Using the Import Wizard
In this exercise you will build a chart from imported data.
1 Click the File tab and select Import Data.
![]()
The Import Wizard - Start dialog box is displayed.
2 Select the I have employee data and it is ready to be imported option and then click Get Started.
3 Select the Microsoft Excel file option and click Next.
4 Click the Browse button and navigate to the Documents\My Charts directory.
5 Select the Tutorial5.xls file and click Open.
6 Click Next.
OrgPlus displays the Import Wizard – XLS Sheet Selector dialog box.

This dialog box allows you to select a worksheet within the Excel file (Sheet1, Sheet2, or Sheet3) to specify whether the first row of data contains column names, and whether the first data row should be used to determine field types.
7 Click Next to display the Import Wizard - Configure Fields dialog box.

This dialog box let you define settings associated with each field in your import file. You can select a field and choose whether to include or exclude it from your chart (columns that display in this dialog box with dimmed data are excluded). You can also rename the selected field and specify field settings such as the field type and whether the field represents a hyperlink.
8 Click Next to display the Import Wizard - Hierarchy Verification dialog box.
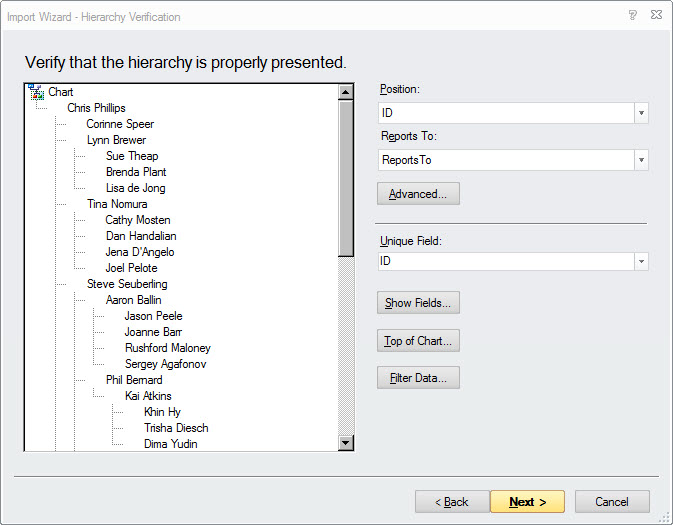
This dialog box allows you to verify that your chart hierarchy will be created properly.
In order to build a chart from imported data, OrgPlus requires two fields: a Position field, which uniquely identifies each box, and a Reports To field, which tells OrgPlus to whom the box reports.
OrgPlus automatically identifies the fields to be used as Position and Reports To. However, you can use this window to verify that the correct fields have been chosen and that there are no errors in the source data.
9 Click Next to display the Import Wizard - Identify Fields dialog box, where you can map OrgPlus predefined fields to the imported fields, when necessary.
10 Click Finish.
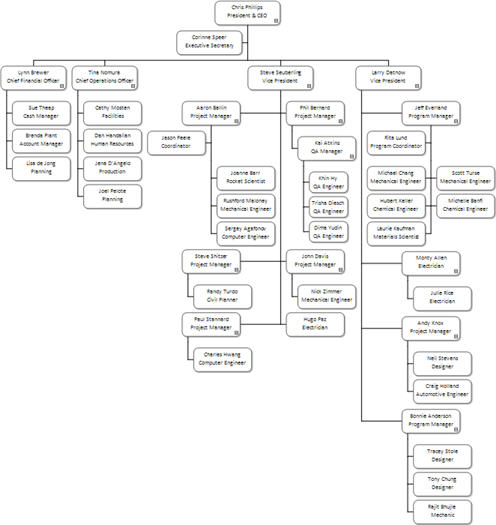
OrgPlus displays the chart you have created. The following example shows a close-up of the chart, with three levels displayed. Notice the box for Tina Nomura, COO. We are going to remove her from the organization after applying a chart template.