OrgPlus enables you to apply background, border, and shadow formatting to a chart, and set the orientation of a chart.
To apply formatting to charts:
1 With your chart open, click the Home tab and select Chart Properties | Color and Lines.
The Chart Properties dialog box opens.

· Define Background properties, as required:
· Color: Use the drop-down control to set the background to a specific color, gradient, texture, or picture.
· Define Border properties as required:
· Border Style: Select the border style.
· Dashed: Select the line type.
· Color: Select the line color.
2 Use the Apply to radio buttons to apply your specifications to either the Entire chart or to the Active sub-chart only.
3 Select the Shadow tab.
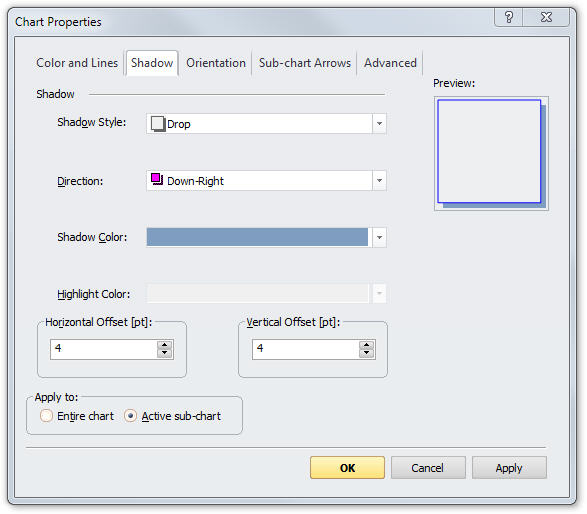
· Define the following, as required:
· Shadow Style: Select a shadow style.
· Direction: Select a shadow direction (enabled only when a shadow is selected).
· Shadow Color: Select a shadow color (enabled only when a shadow is selected).
· Highlight Color: Select the shadow highlight color (enabled only for certain shadow styles).
· Horizontal Offset and Vertical Offset: Select the horizontal and vertical depth of the shadow.
· Use the Apply to radio buttons to apply your specifications to either the Entire chart or to the Active sub-chart only.
4 Select the Orientation tab.

· Define the following, as required:
· Orientation: Select how you want the chart to be drawn. The orientation options are left to right, right to left, top to bottom, or bottom to top.
· Subordinate Alignment: Select how subordinates boxes are to be aligned with respect to their manager.
Note: You can set only one orientation per chart. The orientation you define applies to all sub-charts contained within a chart.
5 Select the Sub-chart Arrows tab.

6 Specify your preferred style for Sub-chart Arrows from the styles shown.
7 Specify a Fill Color and a Border Color for your Sub-chart Arrows:
· By default, the fill and border color of your arrows correspond to the associated box. To specify different colors, uncheck the Use Box Colors checkbox and specify a Fill Color and Border Color for all sub-chart arrows.
8 Optionally, you can add labels to sub-charts arrows. Labeling sub-chart arrows enhances navigation within the chart and improves the usability of your printed and published charts. Select the Show Label checkbox and then select the label type and label position. Click the Font button to modify font properties for the label if needed.
![]()
Note: You can select only one sub-chart arrow style per chart. The sub-chart arrow style you select applies to all sub-charts contained within a chart. You can also change how sub-charts are numbered by setting base and increment values using the Advanced option dialog.
9 Select the Advanced tab.

10 By default each box with one or more subordinate boxes shows a + control in its lower-right corner when its subordinates are hidden and a – control when its subordinates are shown. You can turn off this functionality by clearing the Enable Expand/Collapse of branches checkbox. Turning off display of Expand/Collapse controls reduces the amount of display space required for chart boxes
11 Select the Use Uniform box sizing option make all boxes in a chart the same size, and select the Max width checkbox to specify a maximum uniform size.
12 Continue with the next procedure to learn how to merge fields in a cell.
See: