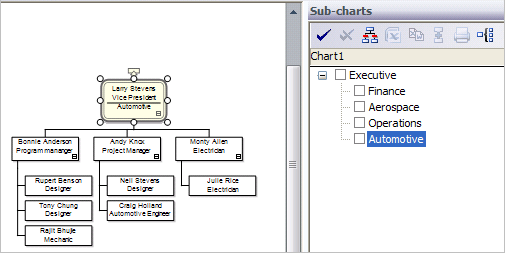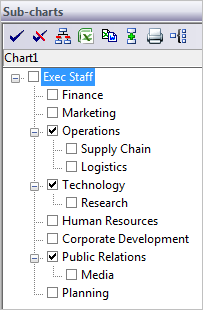
The Sub-chart panel lists the sub-charts in your chart using a tree structure. Clicking a sub-chart name displays the corresponding sub-chart.
The Sub-charts panel toolbar provides the following functions:
|
Icon |
Name |
Description |
|
|
Check All |
Selects all sub-charts. |
|
|
Uncheck All |
Deselects all sub-charts. |
|
|
Create Sub-charts |
Displays the Create Sub-charts dialog box. |
|
|
Send to Excel |
Exports data from selected sub-chart(s) to an Excel spreadsheet. |
|
|
Export Data |
Exports data from selected sub-chart(s) using the Export Data dialog box. |
|
|
Reconnect Sub-chart(s) |
Removes sub-chart breaks from the selected sub-charts. |
|
|
Print Sub-charts |
Prints the selected sub-charts. |
|
|
OrgUnit Chart |
Creates a chart of OrgUnits (or departments) from the hierarchy shown in the sub-charts panel. |
To rename a sub-chart:
1 Make sure the sub-chart panel is displayed by selecting Sub-charts from the View menu.
2 Double-click a sub-chart.
3 Type in a sub-chart name and press Enter.
To navigate sub-charts using the Sub-chart panel.
1
Choose Sub-charts from the View menu.
OR
If the Search panel is open, click the Sub-charts
panel link. The Sub-charts panel
is displayed in the main window.
2 Click on any sub-chart listed in the Sub-charts panel. The corresponding sub‑chart is displayed.
To create an OrgUnit Chart:
1 Make sure the sub-chart panel is displayed by selecting Sub-charts from the View menu.
2
Click on the OrgUnit Chart button ![]() .
.
3 Define your OrgUnit Chart options as follows:
Sub-chart levels: Specify the number of levels to include when creating the OrgUnit chart.
Include Headcounts: Specify whether to include headcounts when creating the OrgUnit chart.
4 Click OK. An untitled OrgUnit Chart is created based on the selected options.