The Summary Panel lets you display the results of formula fields that pertain to the entire chart, such as headcount for an entire branch, salaries for an entire department, and similar values. The Summary panel displays information at a global level (pertaining to the entire chart), regardless of how much of the chart is currently displayed. You can print, copy, and send the summary information to Excel.
To generate summary information:
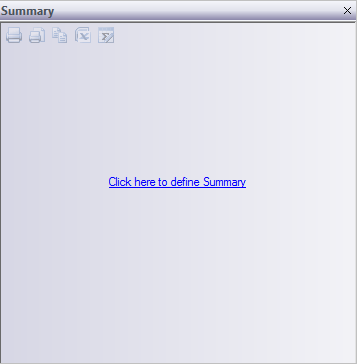
1 Choose Summary from the View menu. The default Summary panel opens.
2 Click the link Click here to define Summary. This opens the Summary Settings dialog box.
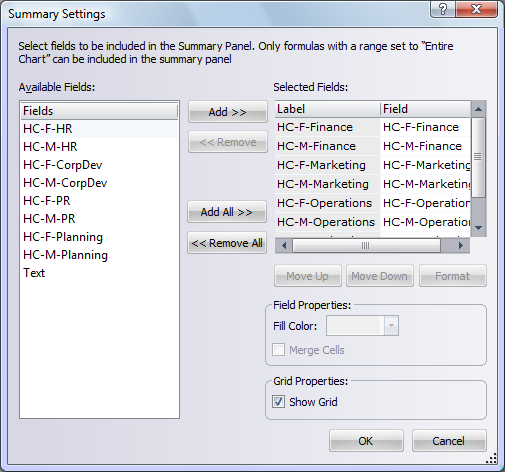
Note: By default, only the formula fields with the range set to Entire Chart appear in this list. The formula fields are: formula fields.
3 To exclude some of the fields, select them (individually using Shift+click or Ctrl+click), and click the Remove button.
4 You can change the order in which the fields and their summary values appear by using the Move Up an Move Down buttons.
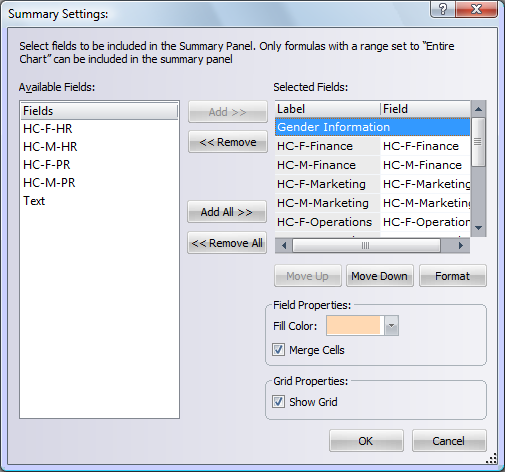
5 Click the Format button and/or select a Fill Color to format the summary information.
6 Select the Merge Cells option to combine the summary data from one or more fields or to provide a single text field. Example.
7
Click OK.
The Summary
panel
displays the formula fields and the totals that have been generated for
the Summary.

You can perform the following actions in the Summary panel:
|
Element |
Name |
Description |
|
|
Print Summary |
Prints the displayed summary. |
|
|
Print Preview |
Previews how the currently displayed profile looks when printed. |
|
|
Copy Summary |
Copies the summary contents to the Clipboard. |
|
|
Send Summary to Excel |
Exports the current summary to an Excel spreadsheet. |
|
|
Edit Summary |
Modifies the displayed summary. |


