OrgPlus Features
OrgPlus has many powerful features, including those described below.
Fast Chart Creation
|
You can import data from a database, spreadsheet, or start from scratch using OrgPlus' intelligent drawing tools. OrgPlus completely automates chart creation. |
|
Powerful Chart Formatting
With OrgPlus, your charts keep pace with your changing organization. You can rearrange boxes by cutting and pasting, or dragging and dropping. You can rearrange the information within boxes manually, or save time by applying predefined templates. OrgPlus automatically preserves uniform sizing and spacing, and shows you an accurate print preview.
Compare Charts
OrgPlus allows you to compare two charts and compare the differences in a detailed, clearly readable report. You can also compare the report data using an Excel spreadsheet.
Master Page
The Master Page feature enables you to define a transparent background page that is used for all the chart pages (similar to the feature available in Microsoft PowerPoint). The master page can include, for example, a corporate logo or photographs, and elements such as page numbers and the date the chart was last updated.
Sophisticated Box Layout
You can rearrange and format data fields, including pictures and photos, within a box to meet almost any design or reporting requirements. OrgPlus also allows you to set the background color and border style for any cell within a box. You can place field labels anywhere in a box (above, below, left, or right of the corresponding field). OrgPlus also allows you to create fixed-size boxes and columns.
Multi-Record and Multi-Column Boxes
You can create boxes that contain more than one record and more than one column. For example, the entire sales team for an organization can be represented in a single box, as follows:
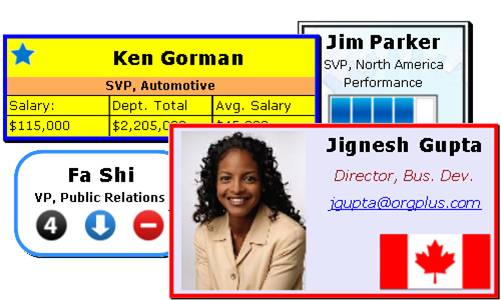
Mapped Fields
Mapped fields allow you to map one value to another value. For example, USA = www.mycompany.com/flags/usflag.jpg.
|
Value |
Maps to |
Result |
|
   US |
/images/usflag.jpg |
|
|
   CA |
/images/caflag.jpg |
|
|
   NL |
/images/nlflag.jpg |
|
|
   CN |
/images/cnflag.jpg |
|
Symbols Library
The My Charts folder contains a library of images that you can use in your charts. The image library is located in the My Documents/My Charts/Symbols folder on your computer.
|
|
|
|
|


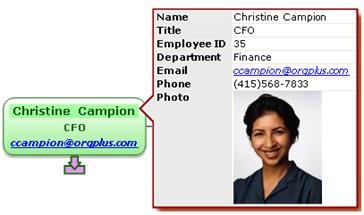
Hotspots
OrgPlus enables you to define any area within a box as a hotspot. When a user moves the cursor over a hotspot a profile is dynamically displayed.
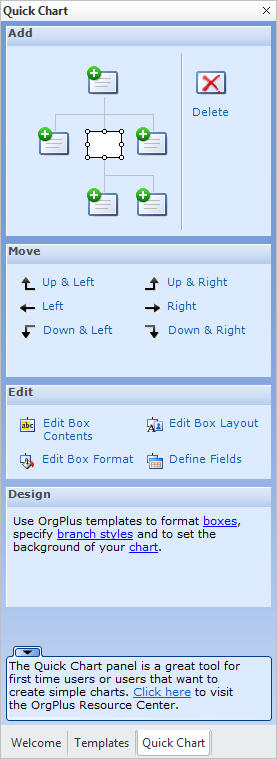
Quick Chart Creator
|
The fastest way to get started with OrgPlus is to use the Quick Chart panel. The Quick Chart feature provides all the controls you need to create basic organizational charts in one easy to use panel. |
|
Templates
Templates provide a predefined starting point for setting up the look and feel of new or existing charts.
OrgPlus supplies a variety of design, box, view, and branch templates that can be used to quickly create professional looking charts.
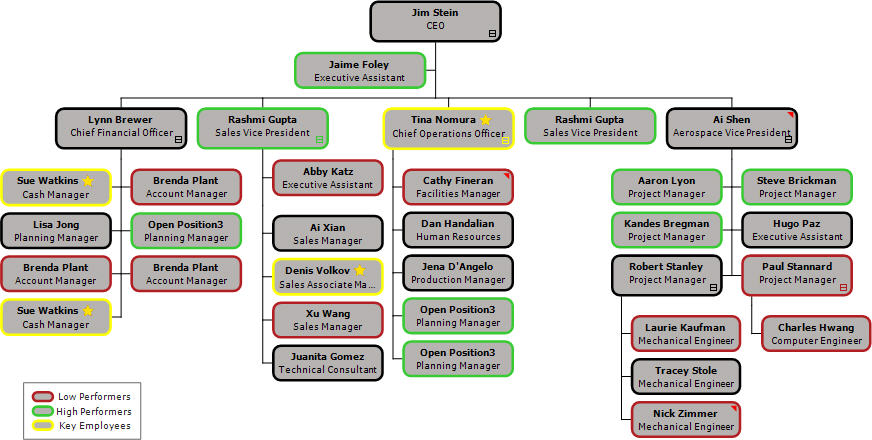
Legends
You can add legends to your charts. Each legend contains one or more color coded legend entries to help end users understand your charts.
OrgUnit Charts
You can create a chart comprised of Org Units (or departments) from the hierarchy shown in the sub-charts panel.
![]()
Optimized Charts
|
Charts can be optimized to fit on one or more pages, making charts easier to read, copy, and distribute. OrgPlus can automatically create compact charts by arranging boxes in the most space-efficient manner. |
|
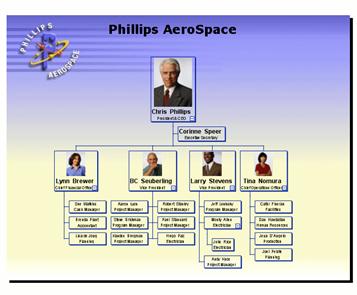
Chart Orientation
OrgPlus supports inverted charts and charts that are oriented left to right and right to left.
Multi-Column Chart Styles
OrgPlus supports multiple subordinate rows under a single manager, including the ability to maintain banding of employees within rows.
Chart Style Rules
Chart Style Rules enable you to change chart branch styles based on your own rules. For example, any box containing an employee with the word Assistant in their title can automatically be reformatted to an assistant style.
Style Rules also enable you to group and demote boxes based on user-defined rules.
Consolidation
Some organizations want to combine multiple organizational charts into a single chart. One common scenario is that each division within a company is responsible for maintaining their own organizational chart using OrgPlus. Using the consolidation feature, each division’s chart can be combined into a single master chart.
Note: This feature is available only in OrgPlus Professional or Premium.
Conditional Formatting
Conditional formatting enables you to dynamically apply formatting to a subset of a chart that meets a set of user-defined criteria. After importing data, conditional formats can be applied to a chart to format any boxes meeting the criteria. For example, any box containing an employee who has more than 10 vacation days could have a thick red border.
Free-Form Tool
OrgPlus automatically positions chart boxes based on the selected branch
style. From time to time, automatic positioning of chart boxes may not
meet your charting requirements. The free-form tool ![]() Â allows you to arbitrarily position
boxes within your chart.
 allows you to arbitrarily position
boxes within your chart.
![]()
Sub-Charting
OrgPlus includes sub-charting as an integral part of the charting process. Previewing and checking sub-charts prior to publishing ensures that published charts are always right the first time.
Sub-Chart Arrow Labels
You can label sub-chart arrows with names or numbers to make navigation easier and improve the value of printed and published charts.
![]()
Dotted-Line Reporting Relationships
In many companies, a single individual may appear in an organizational chart multiple times. Individuals of this type have dotted line reporting relationships to one or more managers. OrgPlus enables you to easily navigate through all occurrences of a dotted line report.
Groups
The Groups feature enables you to define a subset of a chart that meets a set of user-defined criteria. All boxes that do not belong to this subset (or group) are then shaded when this group is selected. This enhances both chart presentation and analysis. For example, a group of all sales people who have met sales goals can easily be visualized.
Conditional Formulas
You can specify which boxes are to be included or excluded from a calculation by using a conditional formula. For example, you can specify the inclusion of only permanent (versus temporary) employees in a calculation.
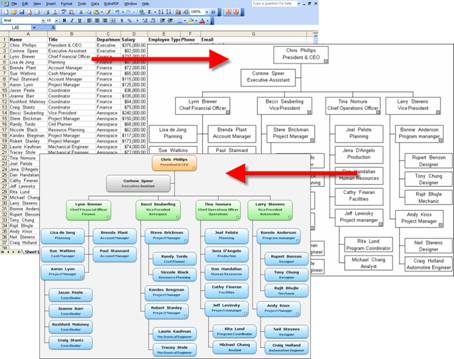
Managing Large Amounts of Complex Data
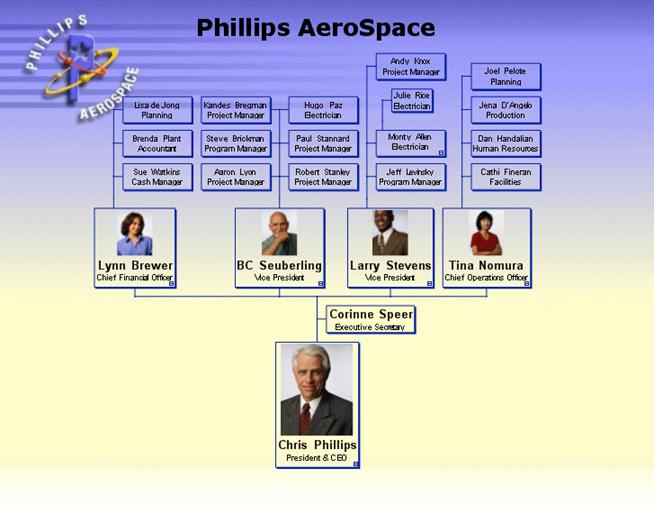
Large charts can be subdivided into sub-charts. For example, an organization with ten divisions can be presented as eleven sub-charts – one for the executive team, and one for each division.
The following figure shows a chart before and after sub-charting, and how sub-charts are navigated.
![]()
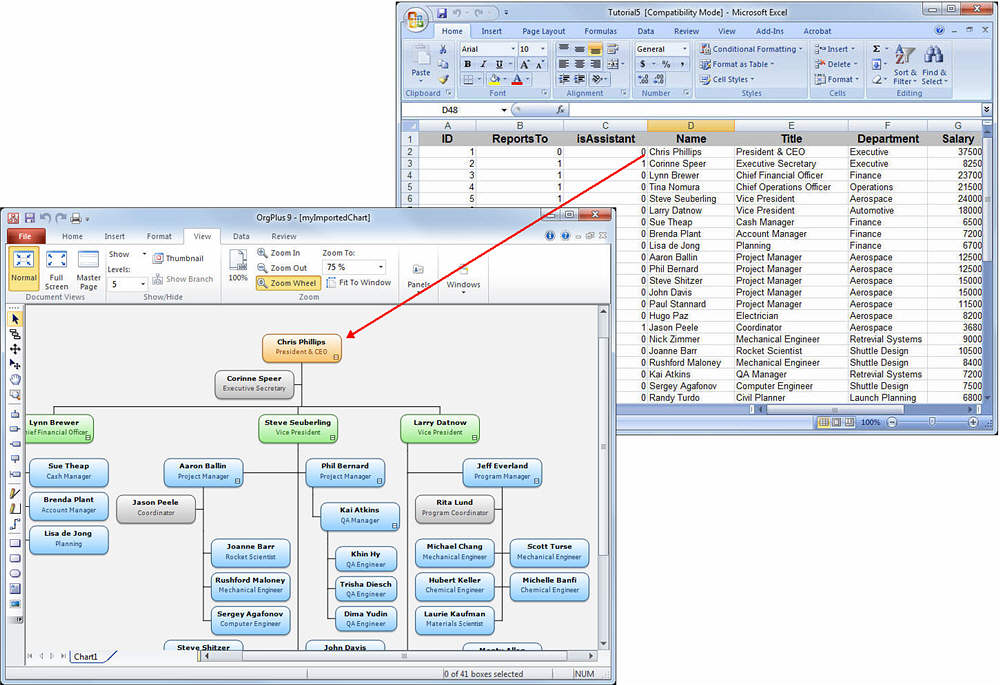
Importing Data from External Sources
OrgPlus ensures that you are always working with the latest information. OrgPlus connects directly to your existing databases using an LDAP, SQL Server, ODBC or Oracle Connection Wizard, or to a spreadsheet or text file. Data can be refreshed at any time, either manually or on a scheduled basis.
Orphan Management
If your data does not contain hierarchy information or your data contains a large number of unassigned positions, OrgPlus makes orphan management easy by allowing you to drag and drop employee records into your charts or sub-charts.
OLE DB Support
OrgPlus supports data import from any OLE DB compatible data source.
Note: This feature is available only in OrgPlus Professional or Premium.
Direct Access to SAP
OrgPlus allows you to import data directly from SAP using the SAP HR-OCI (Organizational Charting Interface). SAP HR-OCI guarantees compatibility with all future versions of SAP and does not require you to load custom software into your SAP environment.
Note: SAP integration requires purchase of the OrgPlus SAP HR-OCI adapter.
Data Synchronization
OrgPlus can refresh data from an underlying data source, such as an Excel spreadsheet, LDAP or relational database. No matter how an organization changes, OrgPlus can maintain chart formatting and publishing parameters.
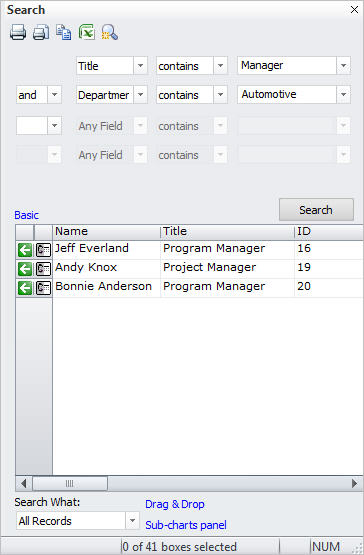
Advanced Search
Perform advanced search functions. The Search Panel displays a tabular list all records based on a user-defined query. The Search panel is useful for finding any set of employees for data mining and succession planning.
Reports
OrgPlus enables you to create both static and dynamic reports from your underlying data. Reports can include summaries and allow you to sort and group data as required. Navigating through the chart dynamically updates the report based on the current cursor position.
Constants (What-If Analysis)
OrgPlus allows you to define constants that you can use in formulas, conditional formats, and chart rules. Changing the value of a constant will update every chart element that references that constant. For example, you can define a conditional format that sets the color of a box based upon whether an employee was hired before or after a specific date. If you reference a constant called "cutoff date" in the conditional format, you can now easily visualize the impact of changing the "cutoff date" to different values.
Multiple Charts per Project and Matrix Reporting
OrgPlus projects can now contain multiple charts, similar to the Microsoft Excel workbook and worksheet concept. Each chart within a project can show a unique view that displays different data fields, contains different formatting, and may even contain a different hierarchy. For example, in an organization that uses matrix reporting, each chart within a project may contain a different project team with its own unique hierarchy.
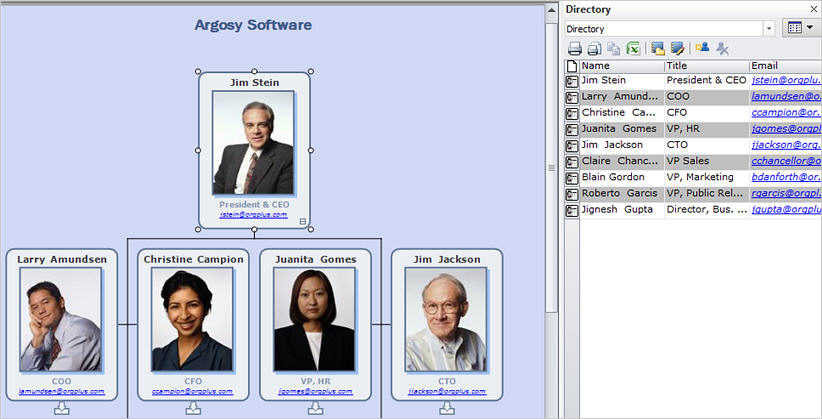
Directories
Directories provide a tabular list of information for a selected box and its descendants. Clicking a box in the chart displays a directory. Conversely, selecting an entry in a directory locates the corresponding box in the chart. You can use the directory to send an email or you can update data in the directory (in the same way that you edit data in a spreadsheet).
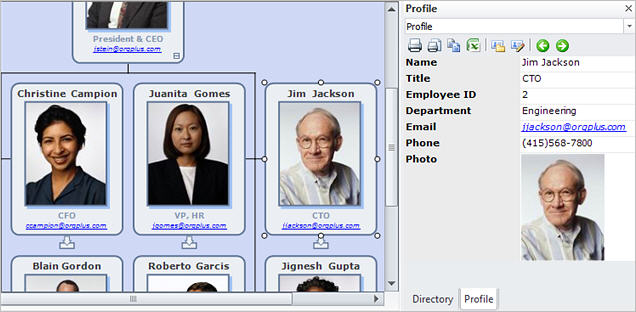
Profiles
The Profile View is a great place to show additional information about a box without cluttering the organizational chart. For example, you can view an employee photo or additional contact information, such as mobile phone or pager numbers in a profile.
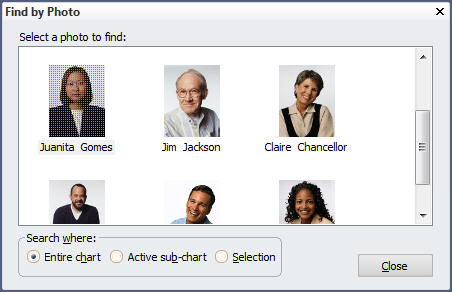
Find by Photo and Photo Manager
|
The Find by Photo feature enables you to find any employee by browsing photo thumbnails. Selecting a photo displays the corresponding box in the chart. Photo Manager intelligently inserts photos into chart boxes. With Photo Manager, the process of managing photos in a chart is almost effortless. |
|
XML Support
Developers can generate XML files that can be loaded directly into OrgPlus using the OrgPlus Plug-In. Please contact op.support@orgplus.com for a detailed specification.
Publishing To and Integration with Microsoft Office
OrgPlus is the only organizational charting program that works seamlessly with Microsoft products, such as PowerPoint and Word. Charts can also be embedded in Microsoft products. Embedded charts can be edited by double-clicking the chart and/or setting the chart to automatically update whenever the underlying chart is updated in OrgPlus.
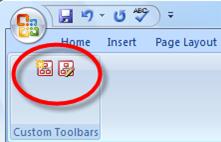
Microsoft Office Toolbar
You can create OrgPlus charts in Microsoft Office applications (Word, Excel, PowerPoint and Visio). The OrgPlus toolbar in Microsoft Office applications enables you to create and edit charts directly in Office documents.
Automation
You can set the Import and Publish processes to run automatically according to a schedule. For example, you can automatically refresh the data every Friday and publish updated charts to established locations on Monday morning.
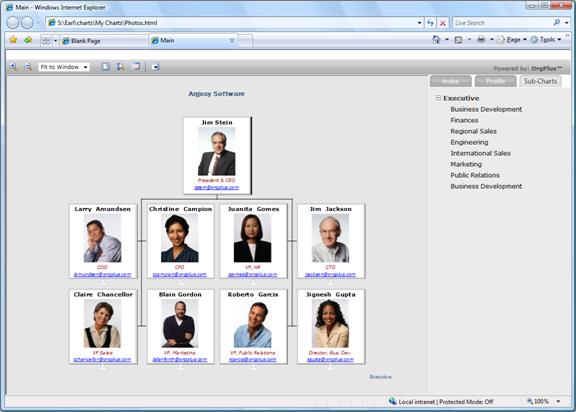
Web Integration
Posting your charts to the web, your corporate intranet or a shared network drive helps reduce the involvement of your IT department.
|
Once posted, your charts become a company-wide information source that connects every employee. Anyone with network or intranet access rights can easily view, search and print published charts using OrgPlus Plug-in. If you prefer, you can publish your charts directly to HTML. |
|
Localization
OrgPlus is Unicode enabled; data from almost any language can be imported into OrgPlus.
508 Compliance
OrgPlus desktop products are 508 compliant (the U.S. Government standard for designing software to meet the needs of people with disabilities).
OrgPlus Enterprise Integration
The automation features of OrgPlus and Push Data functionality make it easy push charts to OrgPlus Enterprise. See Automation, for more details.
Microsoft Vista and Office 2007 Compatibility
OrgPlus is fully compatible with Microsoft Vista and Office 2007.
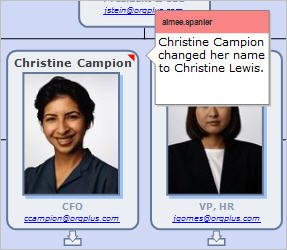
Add Comments
Annotate your organization charts with comments. Comments are useful when collaborating with other OrgPlus users. OrgPlus Reader also supports viewing of comments.
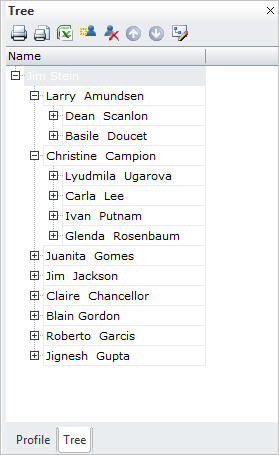
Tree Panel
The Tree panel is a fast and easy way to change your organizational structure or edit chart data. Quickly add, delete, and edit records. Move records across departments with ease.
Automatic E-mail Distribution
OrgPlus can automatically email up-to-date published organization charts (PDF, PowerPoint and Word) to a designated list of email recipients on a scheduled basis or at the push of a button. Define different distribution lists per organization chart file, and keep everyone up to date on the latest organization structure additions, changes, and open positions.
Composite Profiles
You can combine multiple profile views into a single, multi-tab profile view to provide detailed information about any box. You can also conditionally show or hide any individual profile tabs based on the selected box. For example, you can show benefits details for permanent employees only.