 on
your desktop.
on
your desktop.Charts can be created directly in OrgPlus or from within Microsoft Office products (Word, Visio, Excel and PowerPoint).
To create a new chart:
1
If OrgPlus is not already running, double-click the OrgPlus
9 icon on
your desktop.
OR
From the Windows Start menu, choose All Programs | HumanConcepts | OrgPlus 9.
2 Click the File tab and select New to open the New Project dialog box.
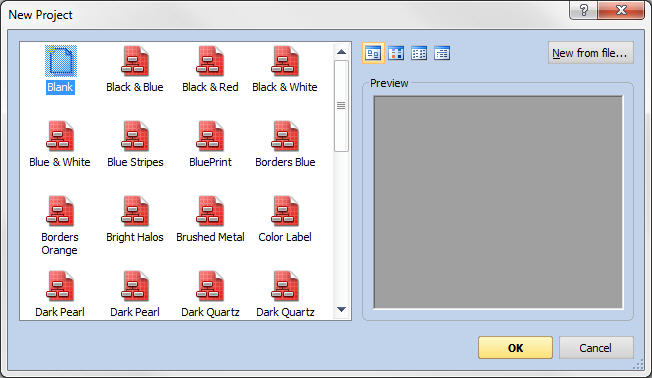
3 Select Blank from the list of templates and click OK. You can also try selecting one of the other chart templates.
The OrgPlus main window displays a blank chart. Continue with step 6 in the topic Entering Field Information.
4
Alternately, to create a chart in a Microsoft Office application,
launch Microsoft Word (or any other Microsoft Office application)
and click the New Chart icon  on the toolbar.
The Microsoft Office application (Microsoft Word in this tutorial) opens and displays a new chart.
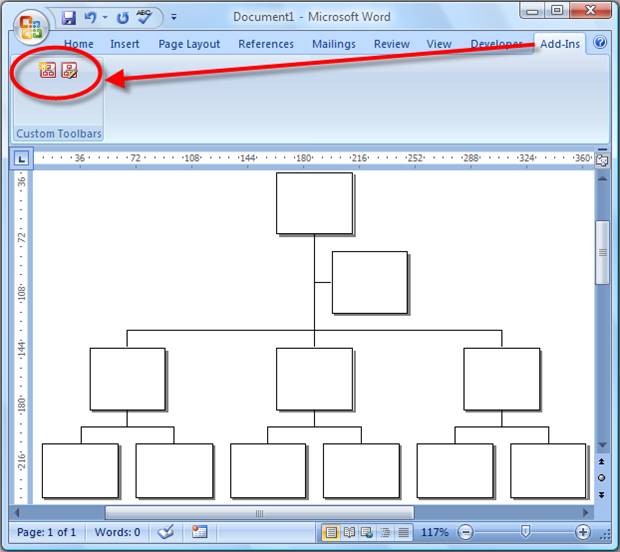
Note: In Microsoft Office 2003 and earlier, the OrgPlus toolbar appears automatically if you selected that option during installation. To display the OrgPlus toolbar icons in Microsoft Office 2007, select the Add-Ins Tab.
5 Double-click the chart to edit it in OrgPlus.