You will now divide the chart into sub-charts.
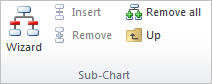
3 Click the Insert tab and select Wizard.
The Create Sub-charts dialog box opens.
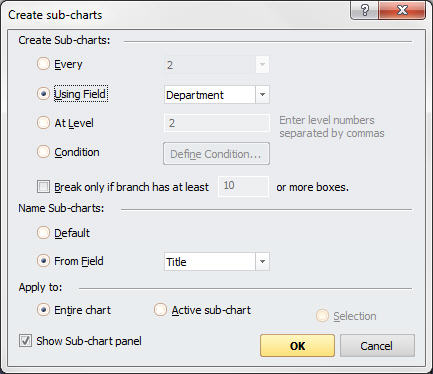
4 Select Using Field and select Department from the drop-down list.
5 Select From Field and select Department from the drop-down list.
6 Click OK.
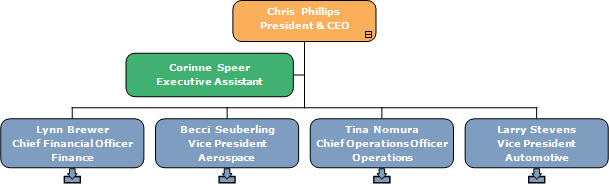
OrgPlus displays the first page of the chart showing only the executive team. Notice the sub-chart navigation arrows at the bottom of each second-level box.