Using the Import Wizard
In this exercise you will build a chart from imported data.
1 Click the File tab and select Import Data.

The Select Data Source dialog box is displayed.
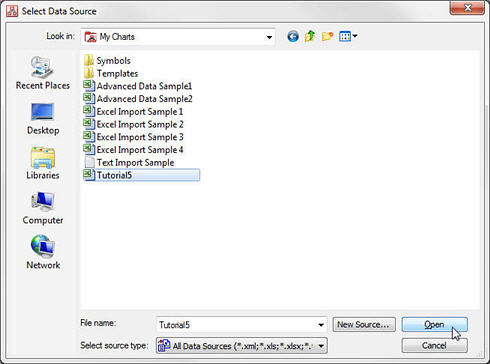
Note: If you do not see the My Charts directory, click the Human Concepts icon in the left margin, then select the Documents file folder then the My Documents icon.
2 Select the Tutorial5.xls file and click Open.
OrgPlus displays the Import Wizard – XLS Sheet Selection dialog box.
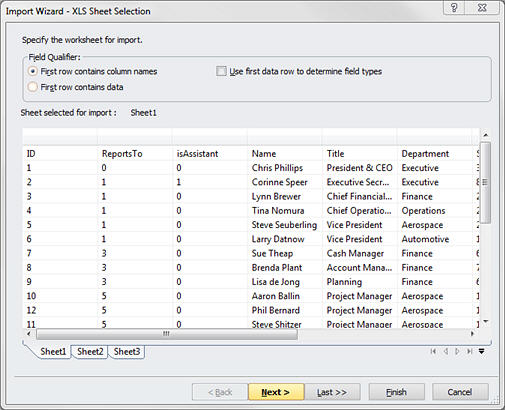
This dialog box allows you to select a worksheet within the Excel file (Sheet1, Sheet2, or Sheet3) and to specify whether the first row of data contains column names or data records.
3 Click Next to display the Import Wizard - Data Settings dialog box.
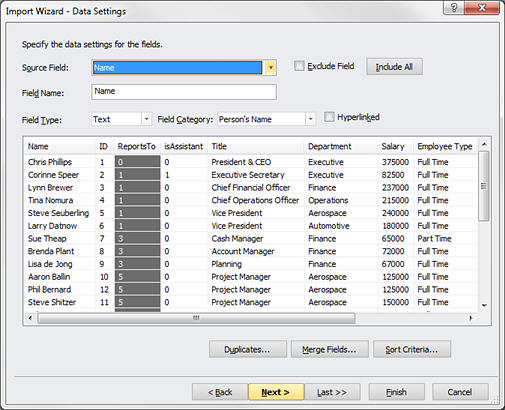
This dialog box enables you to define settings associated with each field in your import file. You can choose whether to include or exclude a field from your chart (gray columns are excluded). You can rename a field, or specify field settings such as whether a field represents a hyperlink.
4 Click Next to display the Import Wizard - Verify Hierarchy dialog box.
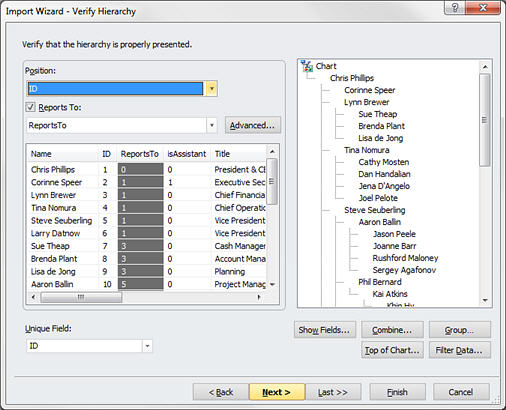
This dialog box allows you to verify that your chart hierarchy will be created properly.
In order to build a chart from imported data, OrgPlus requires two fields: a Position field, which uniquely identifies each box, and a Reports To field, which tells OrgPlus to whom the box reports.
OrgPlus automatically identifies the fields to be used as Position and Reports To. However, you can use this window to verify that the correct fields have been chosen and that there are no errors in the source data.
5 Click Finish to complete the data import.
6 When prompted to save the sub-chart, click No.
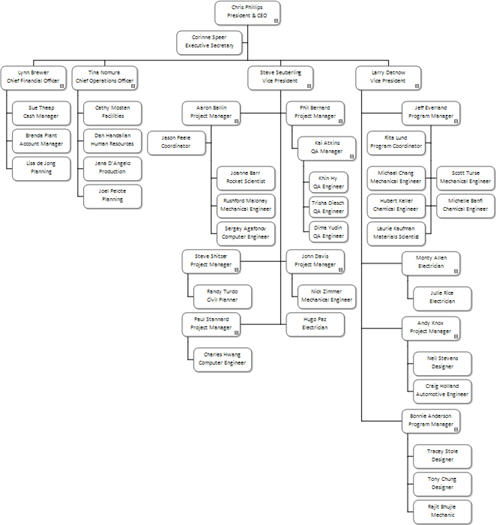
OrgPlus displays the chart you have created. The following example shows a close-up of the chart, with three levels displayed. Notice the box for Tina Nomura, COO. We are going to remove her from the organization after applying a chart template.