The Options panel gives you control over some of the default behaviors of OrgPlus, and lets you select preferences.
To select or modify OrgPlus Preferences:
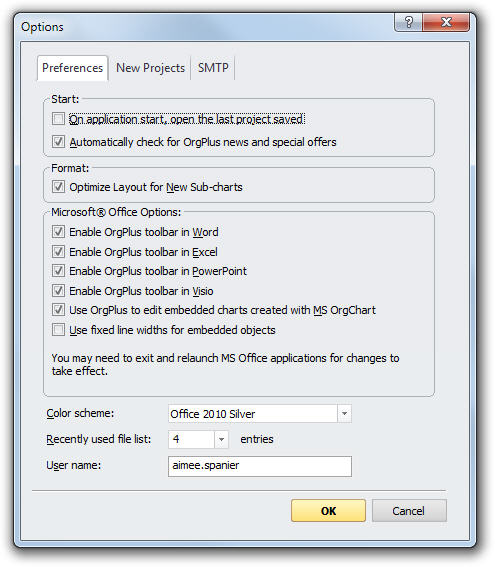
1 Click the File tab and select Options. The Options dialog box opens to the Preferences tab.
2 Modify any of the following preferences:
· On application start, open the last project saved: Opens the last saved project the next time you launch OrgPlus.
· Automatically check for OrgPlus news and special offers: Keeps you informed of news and special offers from OrgPlus.
· Optimize Layout for New Sub-charts: Optimizes the layout of any sub-charts you create. With this option selected, OrgPlus minimizes the number of pages and optimizes the distribution of boxes on a page.
· Microsoft Office Options: Lets you add the OrgPlus toolbar to Microsoft Office applications to create organizational charts in those applications.
· Use OrgPlus to edit embedded charts created with MS OrgChart: By default, embedded charts created with MS OrgChart are opened in OrgPlus. If you want to edit these charts with MS OrgChart, deselect this option.
· Use Fixed line widths for embedded objects: Microsoft Office does not fully support dashed lines. Select this option if you use dashed lines in your charts.
· Color scheme: Lets you select Office 2007 Silver, Blue, or Black. See Selecting a Color Scheme for examples.
Recently used file list: Sets the number of entries listed in the recently used file list in the File tab.
3 Click the New Projects tab.
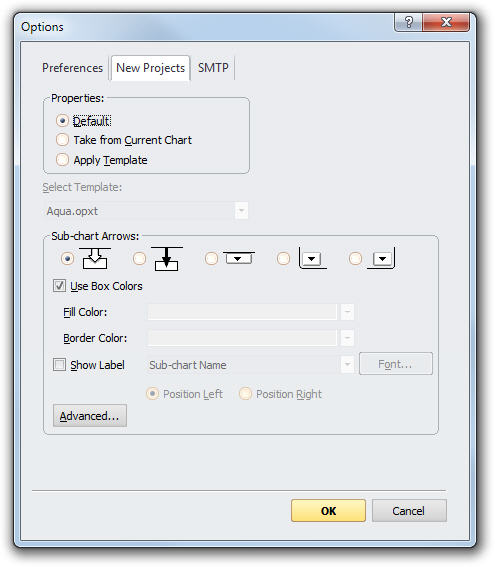
4 Specify your preferences for the new project Properties:
· Default: Applies the blank template, which has minimal formatting.
· Take from Current Chart: Applies the design template used in the currently active chart.
· Apply Template: Allows you to choose a template to apply to new projects. Use the Select Template drop-down list to select a template to apply. You can view a preview of the selected template on the right side of the dialog.
5 Select the default style for Sub-chart Arrows and specify color and label options.
· Use Box Colors: Applies the chart box border and fill colors to your sub-chart arrows.
· Fill Color and Border Color: You can choose a fill color and/or border color from the drop-down menus.
· Show Label: To include a label with your sub-chart arrows click this checkbox and select the label from the drop-down list. If you add a label, select either Position Left or Position Right to specify the label location relative to the arrow. Click the Font button to set the Font Properties for the label.
Note: The Advanced button enables you to change the numbering scheme used for sub-charts. Please see Formatting Charts in Working with Charts: Basic Charting for additional details.
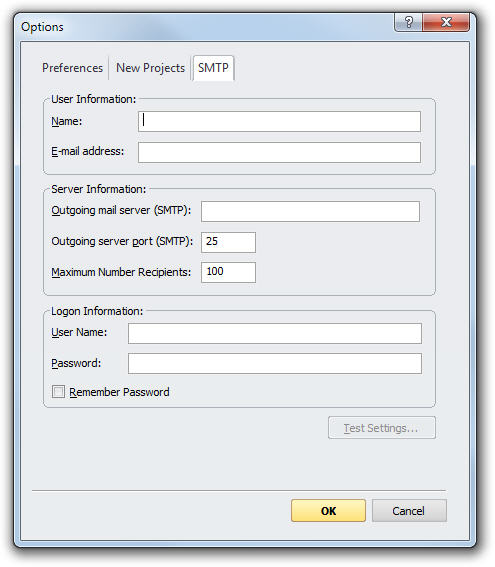
6 Select the SMTP tab to display the SMTP Options. Setting up STMP allows you to automatically e-mail charts after publishing to PDF, PowerPoint, or Word. For more information on publishing charts, see Publishing Your Charts.
Note: The SMTP tab also allows you to set your preferences for e-mail distribution of OrgPlus charts using groups. For more information, see Using Groups for E-mail Distribution in Working with Charts: Basic Charting.
· User Information: Type Name and E-mail Address.
· Server Information: Type the name of the Outgoing mail server (SMTP). Type the number of the Outgoing server port (SMTP). Port 25 is the default. Type the Maximum number of recipients. If you leave this field blank, no maximum is applied by OrgPlus.
· Logon information: Type the User Name and Password. If you want the system to remember the password, click the Remember password checkbox.
· Click the Test Settings button. The system will send a test e-mail to the address you entered in User Information.
7 Click OK to save your changes and close the Options dialog box.