You can add legends to your chart. Each legend contains one or more color coded legend entries. Once a legend has been inserted, it can be moved or resized in the same manner as other free floating objects.
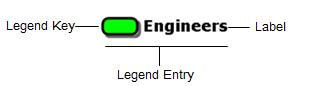
The following diagram contains a legend that color codes full time, part time, and contract employees.
A legend consists of the following elements:
Note: Legends are often linked to Conditional Formats. You may want to create conditional formats before creating a legend. See Creating a Conditional Format for more information on conditional formats.
To add a legend manually:
1 If you want the legend to be shown with every sub-chart, click the View tab and select Master Page from the Document Views section.
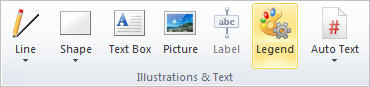
2 Click the Insert tab and select Legend from the Illustrations & Text section.
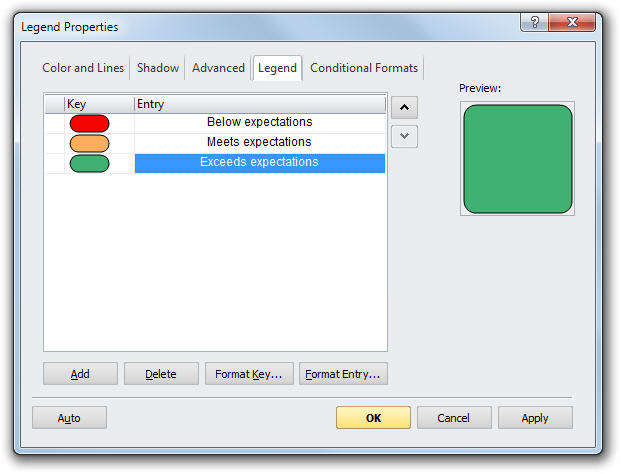
The Legend Properties dialog box is displayed.
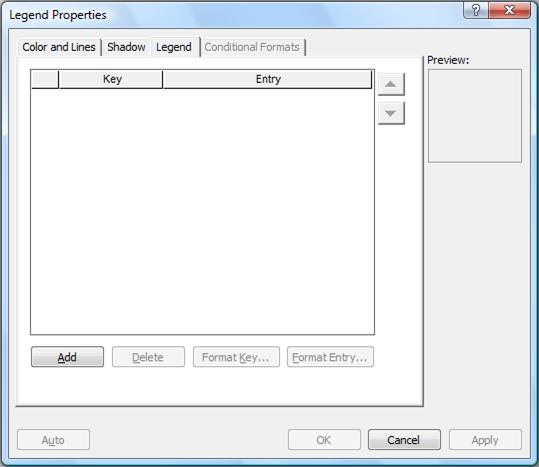
3 Make sure the Legend tab is selected. Click Add to add a legend entry. Repeat to add any number of legend entries.
4 To name an entry, click in the corresponding row in the entry column and enter a name.
5 Click the Format Entry button to set the font properties for an entry.
Note: To delete a legend entry, select the entry and click on the Delete button.
6
To format the key for an entry, click in the corresponding
row in the key column and then select the Format Key button or
click the ![]() button. The Format Legend Key Properties
dialog box is displayed.
button. The Format Legend Key Properties
dialog box is displayed.
7 Use the Color and Lines tab and the Shadow tab to set the display properties for each key. You can also use the Conditional Formats tab to edit a key linked to a conditional format.
8 Click OK.
9 Use the Color and Lines tab and the Shadow tab to set the display properties for the entire legend.
10 Click OK.
To create a legend based on conditional formatting:
If you use conditional formats to differentiate the boxes in your chart, you can create a legend for your chart that is based on those conditional formats. See Conditional Formatting for details on creating and applying conditional formats.
1 Open a chart that includes conditional formats.
2 Click the Insert tab and select Legend to display the Legend Properties dialog box.
3 Click the Conditional Formats tab. This tab is available only if you have defined conditional formats.
4 Select Auto to create a legend that includes all the defined conditional formats or select only the conditional formats you want to include in your legend. You can use the checkboxes to select individual conditions, or click the Check All button.
Note: You can return to this dialog box by double-clicking the legend in your chart.
To delete a legend:
1 Select a legend.
Note: If the legend is located in the master page, click the View tab and select Master Page. Click the View tab and select Normal after deleting the legend.
2 Select Delete from the Edit menu or hit the Delete key on your keyboard.
To edit a legend:
1 Right-click on a legend and select Legend Properties from the context menu. The Legend Properties dialog is displayed.
Note: If the legend is located in the master page, click the View tab and select Master Page. Click the View tab and select Normal after editing the legend.
2 Modify the legend properties using the Color and Lines, Shadow, Legend and Conditional Formats tabs.
3 Click OK.
To edit a legend entry:
1 Select a legend.
Note: If the legend is located in the master page, click the View tab and select Master Page. Click the View tab and select Normal after editing the legend.
2 Select any legend entry.
3 Right-click and select Format Key… from the context menu. The Legend Key Properties dialog is displayed.
4 Modify the legend entry properties using the Color and Lines, Shadow, and Conditional Formats tabs.
5 Click OK.
Note: Click any label within a legend to edit the legend entry name.