New charts in a project either share the same hierarchy as the original chart or have a different hierarchy.
To create a new chart in a project:
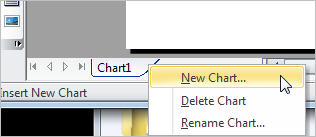
1 Right-click the chart's tab and choose Chart from the popup menu.
The Insert Chart dialog box opens.
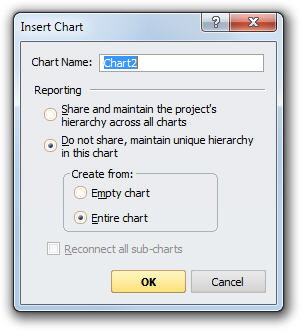
2 Define how you want the new chart to be created:
Reporting: Select if you want to keep the hierarchy synchronized with the current chart or create a new hierarchy:
· Share and maintain the project’s hierarchy across all charts: Copies the existing chart to a new chart. Changes to the hierarchy of the new chart are synchronized with the original chart.
· Do not share, maintain unique hierarchy in this chart: Select from the following options:
· Empty Chart: Creates an empty chart with a new hierarchy.
· Entire Chart: Copies the existing chart to a new chart. Changes to the hierarchy of the new chart are NOT synchronized with the original chart.
· Reconnect all sub-charts: Removes all sub-chart breaks from the new chart.
3 Click OK. The new chart is created and a new chart tab is added at the bottom of the main window.
![]()