Managing Reports
This topic describes how to create a new report, create a report using predefined fields, and how to modify or delete reports.
Creating Reports
To create a new report:
1
With the Reports panel open, click the Manage Reports
button  . The Manage Reports dialog box
is displayed.
. The Manage Reports dialog box
is displayed.
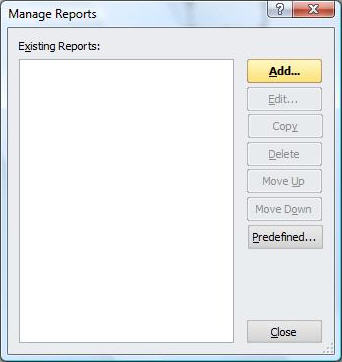
2 Click Add. The Report Settings dialog box opens.
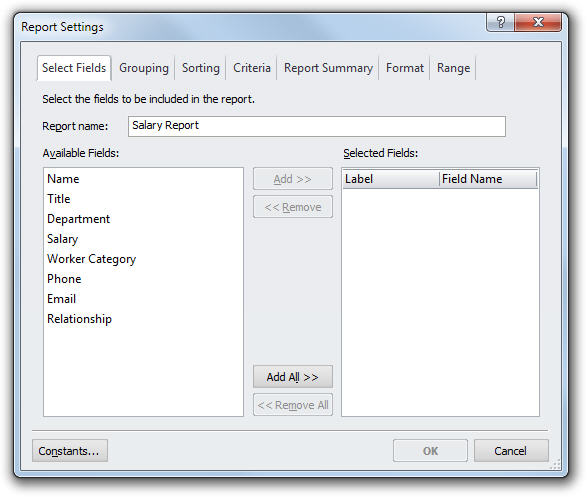
The Select Fields tab enables you to name the report and specify the fields to include.
3 In the Report name field, type the name of your report.
The Available Fields list displays the fields available for your report.
4 Use the following elements to select the fields you want in your report:
|
Element |
Function |
Description |
|
> |
Add Field |
Include the selected available field |
|
>> |
Add All Fields |
Include all available fields in the report. |
|
< |
Remove Field |
Remove selected field from the report. |
|
<< |
Remove All Fields |
Remove all fields from the report. |
5 Optionally, you can include a “relationship” field in your reports. The relationship field displays the relationship with respect to the selected box. To include the relationship, add the field labeled <Relationship> to your reports. Relationship values include:
· Level <N> Manager: <N> corresponds to the level of the selected box’s supervisor. N=1 for the direct supervisor.
· Self: Value corresponding to the selected box
· Peer: Value corresponds to all boxes that share a common manager with the selected box.
· Level <N> Subordinate: <N> corresponds to the level of the selected box’s subordinates. N=1 for the direct subordinates.
6 Click the Grouping tab.
The Grouping tab enables you to group report records based on a chart field. For example, you can create a salary report that groups employees by department (in this example, by organizational unit), and then worker category.
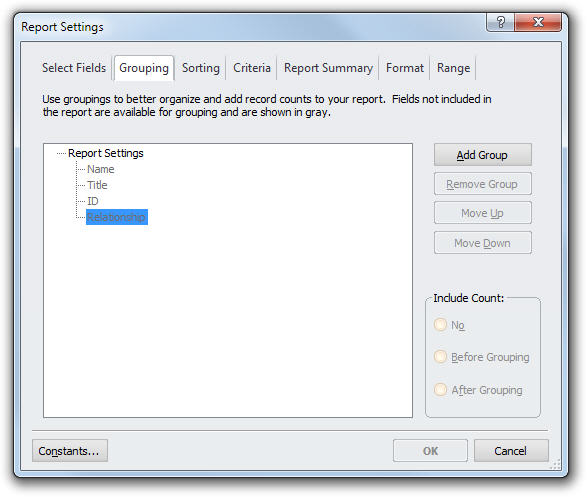
7 Use the following elements to define groupings for a report:
|
Name |
Description |
|
Add Group |
Create a grouping based on the selected field. |
|
Remove Group |
Remove the selected grouping. |
|
Up Group |
Move the selected grouping up. |
|
Down Group |
Move the selected grouping down. |
|
Include Count |
Display a count of the number of records in a grouping. |
8 Click the Sorting tab. Sorting enables you to define the sorting order of the rows displayed in your report.
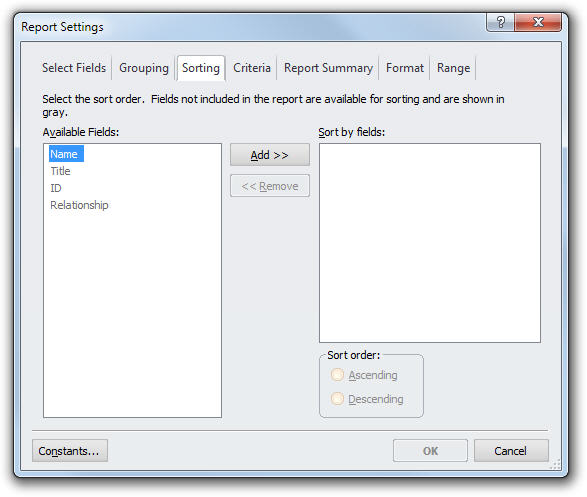
9 Use the following elements to define the sorting of your report rows:
|
Name |
Description |
|
> |
Add the selected available field to the sort list. |
|
< |
Remove the selected field from the sort list. |
|
Sort Order |
For each field included in the sort list, you can specify
whether to sort using Ascending or Descending order. The
|
 or
or  symbol next to each selected field
name indicates the sort order to be used when the report is generated.
symbol next to each selected field
name indicates the sort order to be used when the report is generated.Note: You must add the fields from the Available Fields area into the Sort by fields area, then place then in the order in which you want them sorted.
10 Click the Criteria tab.
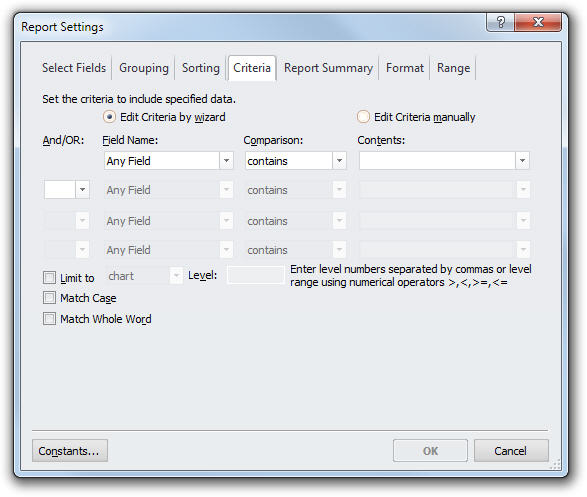
The Criteria tab enables you to define a subset of chart records to include in a report. For example, you may want to report only employees with salaries greater than 50,000.
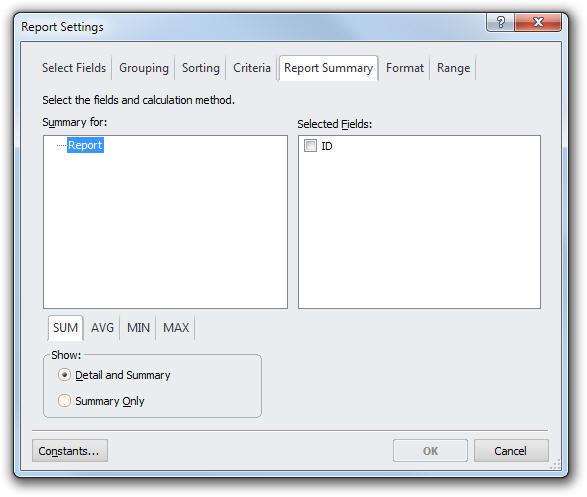
The Report Summary tab is shown only if at least one number or formula field is defined. You can include the SUM, AVERAGE, MINIMUM and/or MAXIMUM value for any defined number or formula field as part of your report.
The Format tab enables you to define the format for each element in the report.
The left panel lists the hierarchy within the
report according to your Grouping and Summary selections. The branches
prefixed with a  indicate the categories of elements.
Each element within a category can be formatted separately.
indicate the categories of elements.
Each element within a category can be formatted separately.
11 Format the report elements listed in the left panel:
· Select an element and click Format. The Properties dialog box appears.
· Define the formatting properties for the report element.
Note: The Properties dialog box for formatting report elements is essentially the same as any Windows formatting dialog.
12 In the Grid Properties area, select the formatting options for the report:
· Show Grid: Includes row and column line separators in the report.
· Odd row fill color: Select the background fill color of odd record rows from the drop-down list.
· Even fill color: Select the background fill color of even record rows from the drop-down list.
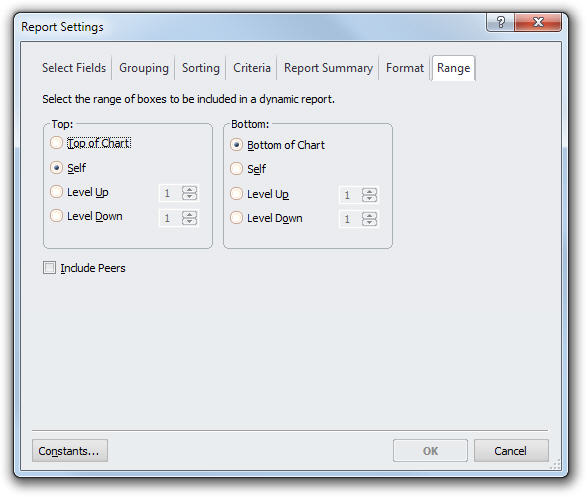
The Range tab enables you to define the range of boxes that will be included in a dynamic report. By default dynamic reports include the selected box and all direct and indirect subordinates (within the current chart or sub-chart).

13 Do the following to define the range of your report:
· Use the Top radio button group to define the topmost box to be included in a report. The topmost box is defined with respect to the selected box.
· Use the Bottom radio button group to define the how many levels of the hierarchy to include in the report.
· Use the Include Peers checkbox to include the selected box’s peers.
14 Click OK.
Note: If the Manage Reports dialog box is displayed, click Close. The report is displayed in the Reports panel.
Using Predefined Reports
The predefined reports function allows you to generate reports based on predefined fields that have been mapped to existing fields in your project.
Before using predefined reports, you must make sure you have identified fields in your project. Identifying fields occurs during the import process (see Identifying Imported Fields), or can be done manually (see Identifying Fields).
To add predefined reports to your project:
1
With the Reports panel open,
click the Manage Reports button
to open the Manage Reports dialog box.
2 Click the Predefined button. The Predefined Reports dialog box opens.
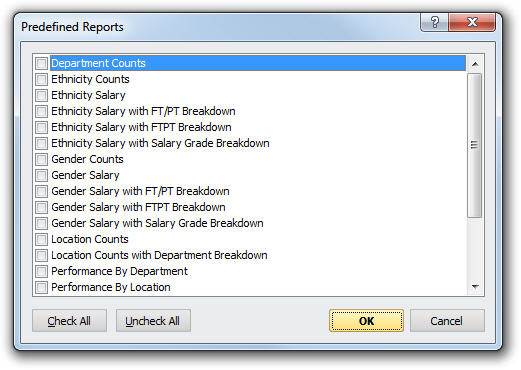
3 Use the checkboxes to select the predefined reports you want to appear in your Reports dropdown menu, and click OK.
4 Click Close in the Manage Reports dialog box. The predefined reports now appear in your Reports dropdown menu.
To generate a report using predefined reports:
· With the Reports panel open, use the dropdown menu to select a predefined report. Predefined reports are listed in a separate section of the dropdown menu, under any user-created reports.
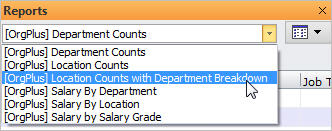
The selected report displays in the Reports panel.
Editing Reports
This topic describes how to modify reports.
To edit the current report:
·
With the Reports panel open, click the Edit current report
button  to modify the report.
To edit any report:
1
With the Reports panel open, click the Manage Reports
button . The Manage Reports dialog box
is displayed.
2 Select a report and click Edit. The Report dialog box is displayed. Modify the report as desired.
3 Click Close to close the dialog box.
Note: You can reorder how reports are displayed in the Manage Reports dialog box using the Move Up and Move Down buttons.
Copying Reports
You can copy a report. Copying a report, then editing the copy is an easy way to create a new report.
To copy a report:
1
With the Report panel open, click the Manage Reports
button . The Manage Reports dialog box
is displayed.
2 Select a report and click Cop
Deleting Reports
You can delete a report that is no longer required.
To delete reports:
1
With the Reports panel open, click the Manage Reports
button . The Manage Reports dialog box
is displayed.
2 Select a report and click Delete.
3 Click Close to close the dialog box.