By default, the Refresh Data command uses the same settings as the original
import. The Refresh Properties dialog box lets you to change the
parameters set during the import process.
You can also archive your chart data with every refresh, or on a daily
or weekly basis. Every refresh creates a new archive file. See the
procedures in Archiving Chart Data
for more information.
Note: The Refresh Properties
feature is only applicable to charts that are created from an external
data source.
To change the refresh properties:
1
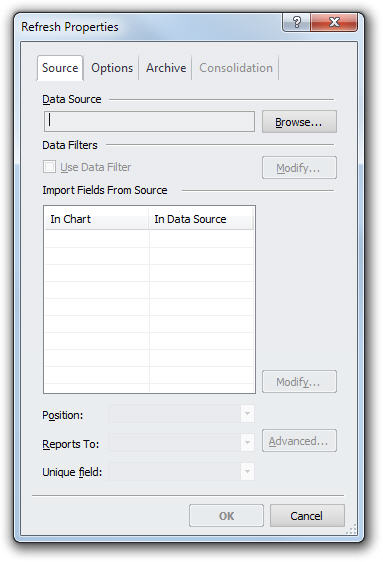
With your chart displayed, click the Data
tab and select Refresh Properties from the Import section to open
the Refresh Properties dialog box.
2
Modify the properties, as necessary, in the Source tab.
·
Data Source: Select a new data source. This is useful
if the original data source has been moved or renamed.
·
Data Filters: During import you can choose to import
a subset of your source data. You can modify the original data filter
to change the subset of source data used during refresh.
·
Import Fields From Source: Select the fields to be
updated during the Refresh process. The fields that are not selected will
not be modified during refresh. The Modify button becomes active
when you select any field.
·
To remap a field: Select any checked field and click
the Modify button. Use the Field from Source drop-down list
to map the field to a data source field.
·
To add a field: Select the checkbox associated with
any unchecked field to display the Modify dialog. Define field
mapping using the OrgPlus Field drop-down list. By default, a new
OrgPlus field with the same name as the data source field is created.
You can name the OrgPlus field by typing directly into the OrgPlus
Field drop-down.
Note: At any time, you can
rename OrgPlus fields by selecting Define Fields from the Home tab.
·
Position: Select the field to be used as the position
field. The position field and Reports To fields are required to build
the chart hierarchy.
·
Reports To: Select the field to be used as the Reports
To field.
·
Unique Field: Select the field to be used as the
unique identifier for each record in the source data. This field is used
to match boxes in the existing chart with records from the data source.
3
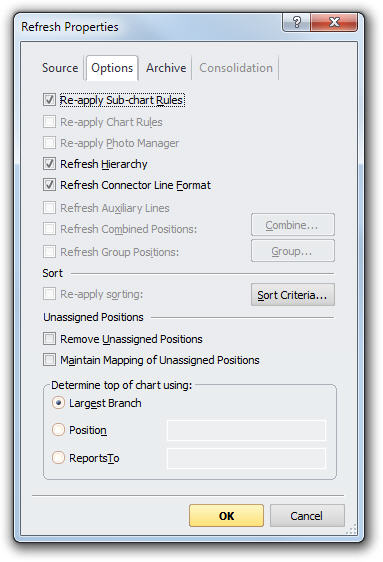
Modify the properties, as necessary, in the Options
tab.
·
Re-apply Sub-chart Rules: After refreshing a chart,
this option re-applies the original sub-chart rules.
·
Re-apply Chart Rules: After refreshing a chart, re-applies
all defined chart rules.
·
Re-apply Photo Manager: After refreshing a chart,
refreshes all photos based on the current Photo Manager settings.
·
Refresh Hierarchy: When Refresh Hierarchy is selected, the
reporting structure of the chart and the contents of each box are updated
during a refresh. When this option is not selected, only information within
the chart boxes is updated. This is useful when the data source contains
incorrect or missing hierarchy information, or when you have manually
modified the hierarchy of the chart.
·
Refresh Connector Line Format: After refreshing the chart,
refreshes all connector lines based on the ReportsToFormat advanced data
field. See Formatting_ReportsTo_Lines in Source Data Requirements for more information
on this field.
·
Refresh Auxiliary Lines: After refreshing a chart,
refreshes all auxiliary lines based on the AuxReportsTo advanced data
field. See Adding
Auxiliary Lines in Working
with Charts: Advanced Charting for more information
on advanced data fields.
·
Refresh Combined Positions: After refreshing the
chart, recombines records into multi-record boxes based on the settings
in the Combine dialog (see Combining Multiple Records
for more information on combining records).
·
Refresh Group Positions: After refreshing the chart, groups
peers based on settings from the Group dialog (see Grouping
Peers for more information).
·
Re-apply Sorting: After refreshing a chart, re-sorts
boxes based on the options defined in the Sort Data dialog box.
·
Remove Unassigned Positions: If you select this option,
orphan records that are currently in the chart, will be removed from the
project in the refresh.
·
Maintain Mapping of Unassigned Positions: Select
this option if you want the refresh to maintain the chart positions of
records that are orphans in the data source.
Note:
You can preserve the current positions of orphan records you have mapped
and prevent the inclusion of further orphan records in the refresh process
by checking both of the Unassigned Positions checkboxes.
Determine top of
chart using:
By default OrgPlus displays the Largest Branch
(chart) that can be created from a data source. You can choose which record(s)
will be designated as the top position in the chart by either specifying
a Position or Reports to value. This is useful in the following
cases:
·
Multiple boxes at the top: To designate more than
one box at the top of chart make sure that each box must have the same
reports to value.
·
Circular Reference at the top: The top boxes
report to each other.
·
Display orphans at the top: All orphan records must
have the same reports to value.