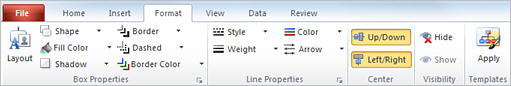
The Format tab contains the following commands, which enable you to format various chart elements. It is divided into five sections, described below.
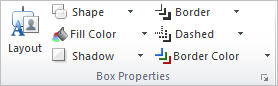
The Box Properties section allows you to format selected boxes, free-floating objects, and pictures in your chart.
|
Command |
Description |
Icon |
|
Layout |
Opens the Box Properties dialog box with the Box Layout tab selected. |
|
|
Box Shape |
Sets the box shape for selected boxes. Click the expansion arrow to select a shape. |
|
|
Fill Color |
Sets the fill color for selected boxes. Click the expansion arrow to select a color. |
|
|
Shadow |
Adds a shadow to selected boxes. |
|
|
Border |
Sets the border style and color for selected boxes. |
|
|
Dashed |
Selects a dashed-line style for box borders. |
|
|
Border Color |
Sets the color of the box border. |
|
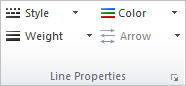
The Line Properties section allows you to format selected lines in your chart.
|
Command |
Description |
Icon |
|
Style |
Sets the style for selected lines.
|
|
|
Weight |
Sets the thickness of selected lines.
|
|
|
Color |
Sets the color for selected lines.
|
|
|
Arrow |
Sets the arrowhead for selected lines. |
|
The Center section moves the chart along a vertical or horizontal axis.

|
Command |
Description |
|
Up/Down |
Center the chart vertically. |
|
Left/Right |
Center the chart horizontally. |
The Visibility section shows or hides selected elements.

|
Command |
Description |
|
|
Hide |
Hides selected boxes or connecting lines. |
|
|
Show |
Shows selected boxes or connecting lines. |
|
The Templates section opens the Apply Template dialog box.