
The View Tab contains commands that enable you to control how your chart is displayed in the OrgPlus window. It contains five sections, described below.
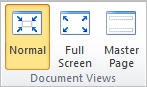
The Document Views section lets you select how your chart is displayed.
|
Commands/Shortcuts |
Description |
|
|
Normal |
Switches to the normal view, which is the default view for most charting tasks. |
|
|
Full Screen/F11 |
Toggles full screen mode. Use Full Screen mode when using OrgPlus to give a presentation. |
|
|
Master Page |
Displays the Master Page. |
|
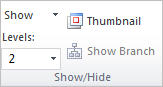
The Show/Hide section lets you control how much of your chart is displayed.
|
Commands/Shortcuts |
Description |
|
|
Show |
Shows or hides: Hidden Boxes, Hidden Lines, Symbols, Hidden Fields, Page Lines, Comments. |
|
|
Show Levels |
Defines the number of levels to show, up to and including the level specified. |
|
|
Thumbnail/ |
Shows a window containing a overview of your chart.
|
|
|
Show Branch |
Shows or hides all boxes not in the selected box's branch. |
|
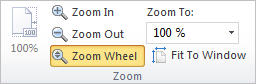
The Zoom section enables you to control the visible size of the chart.
|
Commands/Shortcuts |
Description |
|
|
100% |
Displays the chart at 100% of its actual size. |
|
|
Zoom In |
Increases magnification of the chart. |
|
|
Zoom Out |
Increases magnification of the chart. |
|
|
Zoom Wheel |
Increases and decreases the magnification of your chart using your mouse wheel. |
|
|
Zoom To: |
Use the dropdown menu to select a display size for the chart. |
|
|
Fit To Window |
Resizes the chart so it is visible in the chart in its entirety. |
|
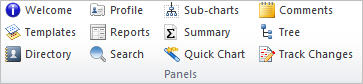
Allows you to select a panel to display on the right side of the main window.
|
Command/Shortcut |
Description |
|
|
Welcome/ |
Displays the Welcome panel. |
|
|
Templates/ |
Shows or hides the Templates panel. |
|
|
Directory/ |
Shows or hides the Directory panel. |
|
|
Profile/ |
Shows or hides the Profile panel. |
|
|
Reports/ |
Shows or hides the Reports panel. |
|
|
Search / |
Shows or hides the Search panel. |
|
|
Sub-charts/ |
Shows or hides the Sub-charts panel. |
|
|
Summary/ |
Shows or hides the Summary panel. |
|
|
Quick Chart/ |
Shows or hides the Quick Chart panel. |
|
|
Comments/ |
Shows or hides the Comments panel. |
|
|
Tree/ |
Shows or hides the Tree panel. |
|
|
Track Changes |
Shows or hides the Track Changes panel. |
|
The Windows section allows you to organize the open windows.
|
Command/Shortcut |
Description |
|
|
New Window |
Open a new window containing a new view of the current project. |
|
|
Switch |
Show another open project in the active window. |
|
|
Cascade |
Arrange windows so they overlap. |
|
|
Stack |
Arrange windows so they overlap and maximize. |
|