Glossary
Use anchoring to connect a free-floating object in your Chart to a Chart Box. When a free-floating object is anchored to a chart box, it moves each time the Chart Box moves.
A directional pointer at the end of a line. Use arrowheads to highlight important information in your Chart or to indicate the flow of procedures or decisions.
A box representing an individual who provides administrative assistance, advice, or managerial assistance to their Manager (sometimes referred to as a staff box).
Different Assistant Styles are available to show the particular type of relationship between the assistant and Manager.
A way to represent the relationship of a Manager to an Assistant. Assistant styles are available by clicking the Home tab and selecting Chart Styles, then choosing an assistant style.
Banding ensures that each box stays on its current row when other boxes are added or deleted. This is useful if rows are used to represent seniority.
A standard graphics image file format. OrgPlus can copy BMP images to and from the Clipboard. It can also copy or cut any visible portion of your Chart to the Clipboard in this format.
A box and all its descendants.
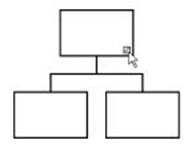
A small square in the lower right corner of manager boxes. It indicates that the box has Subordinate boxes. Click the branch symbol to show or hide the branch.
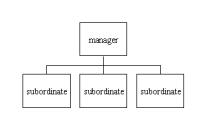
A graphical representation of hierarchical information.
The building block of a Chart. OrgPlus automatically draws Connecting Lines between boxes. The arrangement of chart boxes and the connections between them form a chart.
The area occupied by the chart. This area consists of a single page or a number of pages placed side by side to produce a larger rectangular area. Dotted lines indicate the borders between two adjacent pages. For example:
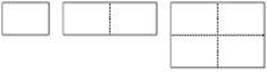
OrgPlus automatically adds and subtracts pages to and from the chart’s page area as needed to contain the chart. It preserves the basic page orientation specified in the Page Setup dialog box.
The particular arrangement of Subordinate boxes with respect to a Manager. Any Subordinate box can have its own chart style. Chart styles are available by clicking the Home tab and selecting Chart Styles.
A temporary storage place in Windows. Use the cut and copy commands to place items on the Clipboard, and use the paste command to paste items from the Clipboard into your Chart.
One or more boxes that share responsibility for a group of subordinates. The highlighted boxes in the figure below are co-managers.
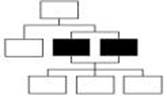
You can show this relationship using the Co-manager style.
The lines OrgPlus draws automatically to connect boxes in the Chart.
Boxes with the same Manager. Together, co-workers form a Group.
You can demote a box to a lower level within a multi-column chart style if the Maintain Banding option is selected.
A special reporting relationship between two boxes in the Chart. A dotted line usually indicates that one box has some measure of authority over the other box.
You can embed an object in an OLE client document. When you embed an object in an OLE client document, you place a copy of the original object into the client document. It is then completely separate from the original chart. You can edit the embedded object independently from the original chart.
An area in a Chart Box where you can type information such as a person’s name or salary.
The way Fields are arranged in your Chart Boxes. Different boxes can have different field layouts.
A field type used for performing calculations in your Chart.
All of the boxes reporting to the same Manager, excluding Assistant boxes. A group is also a set of boxes that all meet a specified condition.
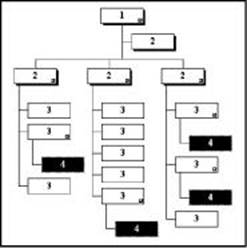
The Topmost Box in your chart is at level 1. The boxes reporting directly to it are at level 2. The boxes reporting to them are at level 3, and so on. The black boxes in the figure below are at level 4.
You can link an object to an OLE Client document. When you link an object to an OLE client document, the object appears in the client document. The client document is automatically updated when you make a change to the original OrgPlus document.
A box that has subordinate boxes reporting to it.
A standard graphics image file format. Metafiles require less disk space than a regular Bitmap (BMP).
OrgPlus supports Object Linking and Embedding (OLE), a feature that lets you create and edit a chart in OrgPlus, and automatically transfer a copy of it to another application. Other applications that support OLE include word processors and desktop presentation programs. Once your chart is linked to or
Embedded in a Windows OLE client application, you can double-click to edit the chart from another application.
An application to which you can link or
Embed an OLE Object created by a OLE Server application. OrgPlus functions as a server application. An OLE client application, such as Microsoft Word, contains a copy of the chart.
A chart or a portion of a chart you can place in another Windows application using Object Linking and Embedding (OLE).
An application that can create OLE Objects to link or embed in an OLE Client application. An OLE server application such as OrgPlus creates the chart; an OLE client application such as Microsoft Word contains the chart.
Pages lines demarcate header and footer areas, print margins, and page breaks. These lines do not print.
You can promote a box to a higher level within a multi-column chart style if the Maintain Banding option is selected.
When you click the secondary mouse button on an object or window, OrgPlus displays a context menu containing commands for that object or window.
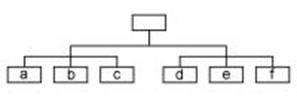
A grouping of boxes within a larger group. In the figure below, a, b, and c belong to one subgroup, and d, e, and f belong to another subgroup. Both of these subgroups belong to the same Group because they have the same Manager.
Any box that reports to another box.
A graphics image file format supported by many DOS, Windows, and Macintosh applications.
A template defines all the formatting parameters for a chart. Applying a template sets the formats for chart elements, such as boxes and lines. Using templates saves you the effort of formatting each individual chart element. Using templates in OrgPlus is very similar to using templates in Microsoft PowerPoint or Word.
A window containing a miniature of the entire Chart. You can click in the thumbnail window to navigate to any part of your chart.
The box at the top of the Chart.
The universal character encoding, maintained by the Unicode Consortium (http://www.unicode.org/). This encoding standard provides the basis for processing, storage and interchange of text data in any language in all modern software and information technology protocols.
Allowing a phrase or sentence to split – or wrap – from one line to the next, as opposed to requiring it to fit on a single line. (This paragraph is wrapped.)