 button to display the Mapping
dialog box.
button to display the Mapping
dialog box.Mapped fields allow you to connect field values to information displayed in those fields.
Say, for example, your data includes an Ethnicity field. The existing data contains values such as AfAm, As, Hisp, Wh, and the like, but you want to display those values more easily-understood terms (African American, Asian, Hispanic, White, and so on). You can map the existing, shortened field values full terms, and display those terms in the chart boxes.
To create mapped fields:
1 Click the Home tab and select Define Fields from the Fields & Formulas section. OrgPlus displays the Define Fields dialog box.
2 Click the Add Mapped Field button in the Define Fields dialog box.
3 Name the field and use the Type dropdown menu to select Text.
4
Click the Options button to display the Mapping
dialog box.
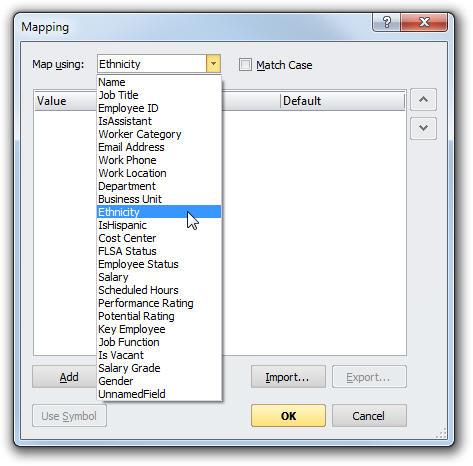
5 Click the Map Using: dropdown list to select the field you are mapping. In the example above, you would choose the field Ethnicity, which is the column in the source data where the codes (AfAm, As, etc.) are listed.
6 Click the Add button.
7 In the Value column, use the dropdown menu to select an original value.
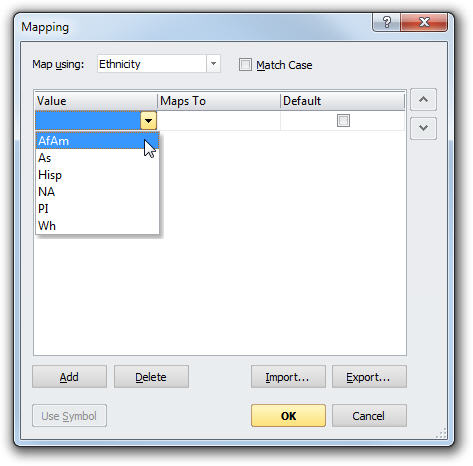
8 In the Maps To column, type the new value (African American, Asian, and so on) you want to appear in place of the original value.
9 Repeat steps 5-7 until all mapping is complete, and click OK.
10 Click OK in the Define Fields dialog box. The new value is added to your chart boxes.
You can use the mapped fields option to convert text values to numbers.
For example, if your source data includes performance ratings of Above Target, On Target, and Below Target, you can easily convert them to numeric values (1, 2, and 3).
You can use mapped fields to map field values to pictures, as shown in the following table.
|
Value |
Maps to |
Result |
|
US |
\symbols\us_flag.png |
|
|
France |
\symbols\fr_flag.png |
|
|
Germany |
\symbols\de_flag.png |
|
In fact, OrgPlus includes a directory of images that you can include in your charts. The image directory is located in the Symbols folder in your My Charts directory. The My Charts directory is located in your My Documents folder.
To map a field to a picture:
1 Click the Home tab and select Define Fields from the Fields and Formulas section. OrgPlus displays the Define Fields dialog box.
2 Click the Add Mapped Field button in the Define Fields dialog box.
3 Name the field and use the Type dropdown menu to select Picture.
4
Click the Options button to display the Mapping
dialog box.

4 Click the Map Using: dropdown list to select the field you are mapping.
5 Click the Add button to define each mapping pair. For example, you can map US to Flag_USA and CA to Flag_Canada. Use the Delete button to delete mapping pairs.
6 Use the Default checkbox to specify the default mapping. The default mapping is used if a matching value cannot be found.
7 Click OK.
Note: You can import a list of mapping pairs using the Import button.
See:


