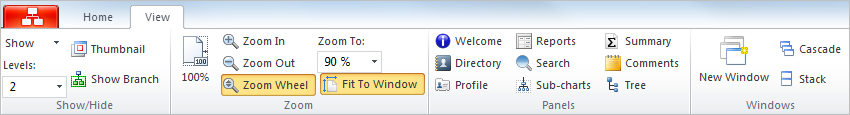
The View Tab contains commands that enable you to control how your chart is displayed in the OrgPlus window. It contains four sections, described below.
The Show/Hide section lets you control how much of your chart is displayed.
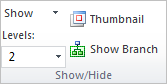
Show: Shows or hides Hidden Boxes, Hidden Lines, Symbols, Hidden Fields, Page Lines, Comments.
Show Levels: Defines the number of levels to show, up to and including the level specified.
Thumbnail/Ctrl+H: Shows a window containing a overview of your chart.
Show Branch: Shows or hides all boxes not in the selected box's branch.
The Zoom section enables you to control the visible size of the chart.
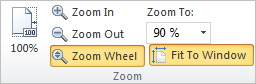
100%: Displays the chart at 100% of its actual size.
Zoom In: Increases magnification of the chart.
Zoom Out: Decreases magnification of the chart.
Zoom Wheel: Increases and decreases the magnification of your chart using your mouse wheel.
Zoom To: Use the dropdown menu to select a display size for the chart.
Fit To Window: Resizes the chart so it is visible in the chart in its entirety.
Allows you to select a panel to display on the right side of the main window.
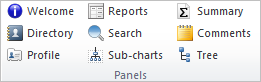
Welcome/Ctrl+Shift+W: Displays the Welcome panel.
Directory/Ctrl+Shift+D: Shows or hides the Directory panel.
Profile/Ctrl+Shift+F: Shows or hides the Profile panel.
Reports/Ctrl+Shift+R: Shows or hides the Reports panel.
Search /Ctrl+Shift+H: Shows or hides the Search panel.
Sub-charts/Ctrl+Shift+S: Shows or hides the Sub-charts panel.
Summary/Ctrl+Shift+Y: Shows or hides the Summary panel.
Comments/Ctrl+Shift+C: Shows or hides the Comments panel.
Tree/Ctrl+Shift+E: Shows or hides the Tree panel.
The Windows section allows you to organize the open windows.
New Window: Open a new window containing a new view of the current project.
Cascade: Arrange windows so they overlap.
Stack: Arrange windows so they overlap and maximize.