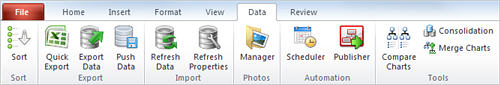
The Data tab enables to manage or export data from your chart. It contains six sections, described below.
The Sort function allows you to sort subordinate boxes reporting to the same manager.
![]()
|
Commands/Shortcuts |
Description |
|
|
Sort |
Sorts selected boxes. |
|
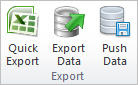
The Export section contains tools to export and push your chart data.
|
Commands/Shortcuts |
Description |
|
|
Quick Export |
Publish your chart as an Excel spreadsheet. |
|
|
Export Data/Ctrl+T |
Exports data from your chart into a number of formats. |
|
|
Push Data |
Exports data from your chart to an FTP site or a file server. |
|
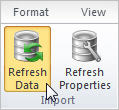
The Import section contains tools to import and refresh your data.
|
Commands/Shortcuts |
Description |
|
|
Refresh Data |
Re-imports data from the underlying data source. |
|
|
Refresh Properties |
Modifies parameters set during the import process. These parameters are used when you Refresh Data. |
|
The Photos section launches the Photo Manager.

|
Commands/Shortcuts |
Description |
|
|
Manager |
Inserts photos into boxes in your chart using a wizard. |
|
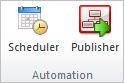
The Automation section sets up scheduled processes.
|
Commands/Shortcuts |
Description |
|
|
Scheduler |
Creates, modifies, or schedules Refresh and Publish tasks. |
|
|
Publisher |
Republishes any previously published file. |
|
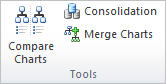
The Tools section enables you to compare, consolidate, or merge two charts.
|
Commands/Shortcuts |
Description |
|
|
Compare Charts |
Compares two charts, and allows you to generate reports. |
|
|
Consolidation |
Combines multiple charts into a single chart. |
|
|
Merge Charts |
Merges two projects into a single chart. |
|