Altula
- Contact Us
- Contact Us
- 877-908-2113 (Canada)
- +44 (0) 2036 080 627 (UK)
- Sales
- Languages
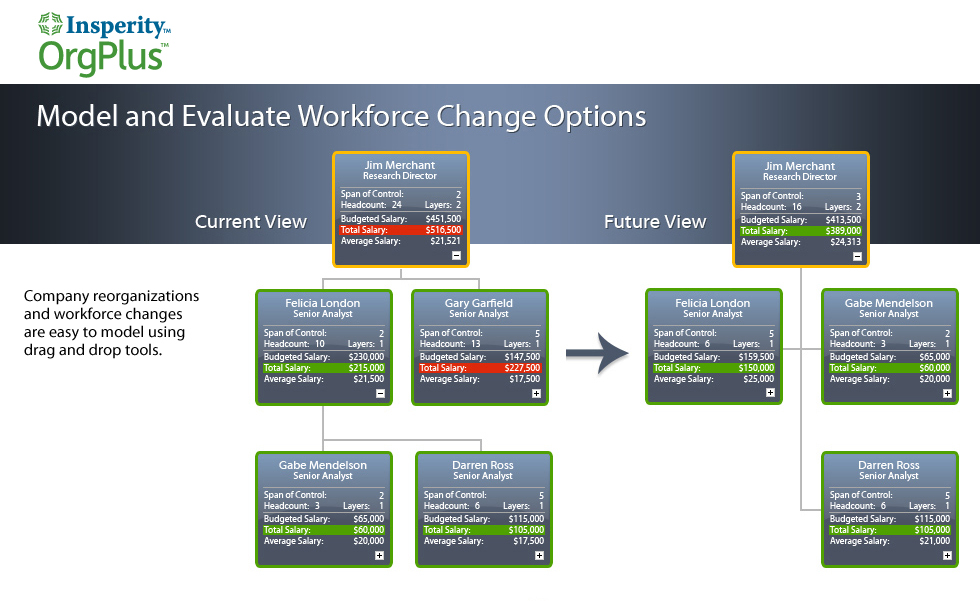
In this example, you’ll learn to take advantage of the tab feature to access the current chart as well as a plan for a future chart in the same project.
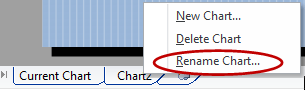
Step 1: Click the Insert tab button found in the bottom left corner of the screen.

– Note that a copy of your existing chart is automatically created.
– Right-click each tab and select Rename Chart to enter a chart name.
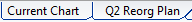
In this example, one chart tab is labeled ‘Current Chart’ while the other is labeled ‘Q2 Reorg Chart.’
Step 2: Now use the new chart to visualize an upcoming reorganization:
– Click the Q2 Reorg Plan tab.
– Edit the chart as desired. For example, you could add or delete boxes, change department or title names, or move employees from one branch to another.
– The changes you make to this chart do not affect your original chart, so you can view different versions of your organization’s hierarchy by selecting one chart tab or the other.
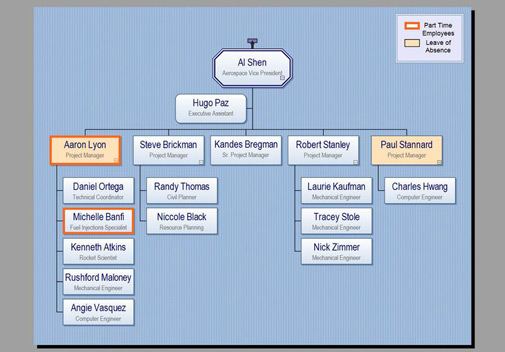
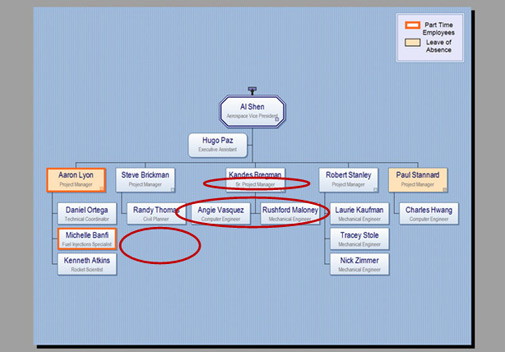
*The chart above shows the Current Chart. The chart below shows the Q2 Reorg Chart. Notice that several boxes have been moved, deleted or edited in the Q2 Reorg Chart without affecting the Current Chart.
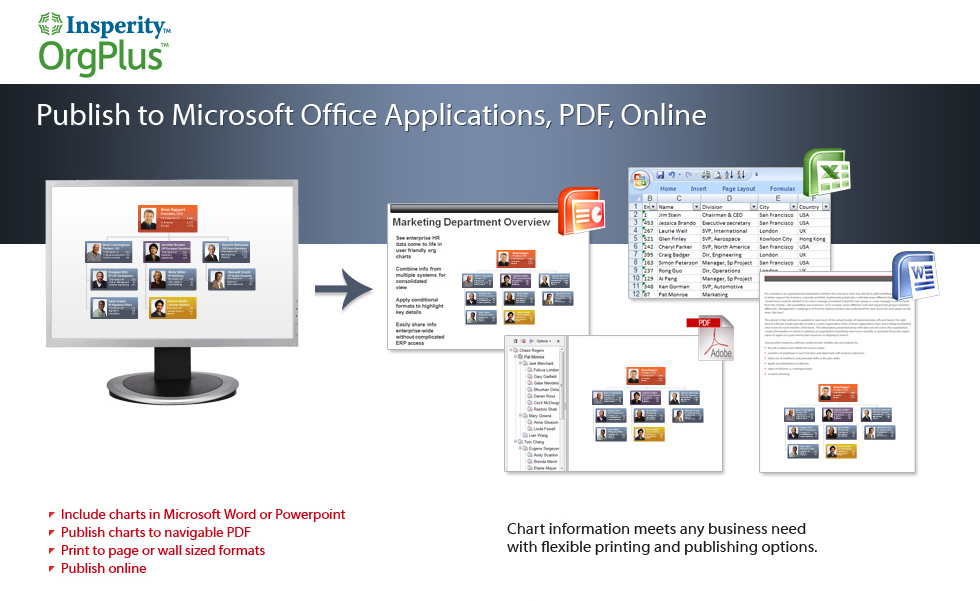
Step 3: Publish your project to PowerPoint:
– On the File menu, select Publish to PowerPoint
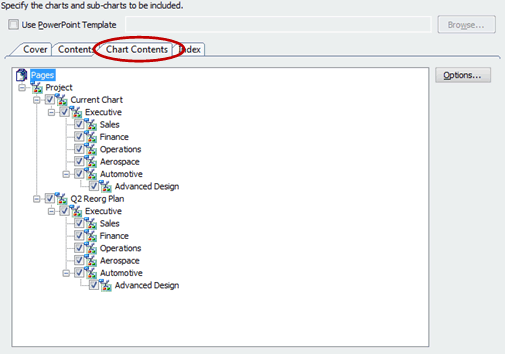
– On the second screen of the publishing wizard, select the Chart Contents tab. Notice that all chart tabs in the file are automatically included and will be published.
– Complete the steps of the publishing wizard.
You’re now ready to do a presentation featuring your current chart and a future chart plan!