Source data must be formatted correctly to be imported into OrgPlus. For more information, see:
Data sources must contain a Position field and a Reports To field. OrgPlus cannot build a hierarchical chart unless these fields are available during the import process.
· Position field
Each record must have a Position field. Usually a numeric ID such as a position code or employee ID is used for the Position field. An email address can also be used. Using an employee name is not recommended as names are not unique.
· Reports To field
In order to determine the reporting relationship (such as, who reports to whom), each record must contain a Reports To field. The Reports To field enables OrgPlus to build a hierarchical chart. For information on formatting the lines connecting managers and their reports, see Formatting ReportsTo Lines.
Note: OrgPlus can also handle data that contains a hierarchy that cannot be processed using only the Reports To and Position fields. See Complex Hierarchies for more information.
You can import a file from any source as long as it meets some minimum requirements.
Use the following guidelines when creating an import file:
To prepare your text for importing:
1 Create one line in the file for each record in your chart.
2 If you are importing from a text file, each field must be separated by a delimiter (a tab, comma, semicolon, space, or other character).
· In the following example, each record has four fields, separated by commas. The four fields are Position, Reports To, Name, and Title. Position is used as the unique identifier for each record.
1, ,Chris Phillips,President
2,1,Lynn Brewer,Chief Financial Officer
3,1,Larry Stevens,Vice President
3 If you are importing from Excel you do not need to worry about commas. Each field should be entered into a cell.
|
1 |
|
Chris Philips |
President |
|
2 |
1 |
Lynn Brewer |
Chief Financial Officer |
|
3 |
1 |
Larry Stevens |
Vice President |
4 You can, in addition, enclose each field value within text delimiters.
For example, if you separate fields with spaces, you need to enclose field values within another delimiter if the field values themselves contain spaces. Field values can be enclosed in double quotes, as in the following example: “2" "1" "Lynn Brewer" "Chief Financial Officer"
5 If you want to use one of your text delimiters as a literal character, precede it with an escape character.
For example, if a field value contains a double-quotation mark, place a backslash (\) in front of it so that OrgPlus knows it is a literal quote character and not the delimiter for a field.
6 Each record must contain a Position field and a Reports To field. Otherwise, the import wizard cannot determine the relationship between records.
7 You can create a header row that tells OrgPlus the names of the fields in the Text or Excel file.
If you create a header row, it must be the first row in the file. Instead of field values, the fields in this row contain the names of the fields themselves, for example: employee name, position, reports to, and title.
8 Make sure there are no blank lines in the file.
Your source can also include Advanced Data Fields. Advanced data fields automate chart formatting and can be used to identify assistant boxes, insert sub-chart breaks, hide branches, or specify the chart styles of selected branches. In addition, advanced data fields can also be used to identify rows to ignore during the import process.
In order to use advanced data fields, you must include a header row in your import file. The header must with contain columns that correspond to each utilized advanced data field. If you are importing from a database, the fields in the source database table (or view) must be named to match an advanced data field. A typical Excel import file would be constructed as follows:
|
ID |
ReportsTo |
Name |
Title |
IsAssistant |
BreakAt |
|
1 |
|
Lynn Brewer |
CEO |
0 |
0 |
|
2 |
1 |
Larry Stevens |
Assistant |
1 |
0 |
|
3 |
1 |
Claire Chancellor |
VP |
0 |
1 |
The following topics describe the available advanced data fields:
If an employee regularly reports to more than one supervisor, add the AltReportsTo column to your data fields. Like the ReportsTo data field, AltReportsTo must be a list of numbers, separated by semicolons, referring to the line numbers of those on the list to whom this employee reports.
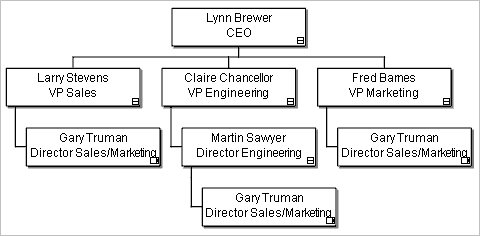
In the example below, Gary Truman reports to three people: Larry Stevens (line 2), Fred Barnes (line 4) and Martin Sawyer (line 6).
|
ID |
ReportsTo |
AltReportsTo |
Name |
Title |
|
1 |
|
|
Lynn Brewer |
CEO |
|
2 |
1 |
|
Larry Stevens |
VP Sales |
|
3 |
1 |
|
Claire Chancellor |
VP Engineering |
|
4 |
1 |
|
Fred Barnes |
VP Marketing |
|
5 |
2 |
4;6 |
Gary Truman |
Dir. Sales/Marketing |
|
6 |
3 |
|
Martin Sawyer |
Dir. Engineering |
Here, Gary Truman will appear multiple times on the resulting chart, as a subordinate to all three of the people listed under ReportsTo and AltReportsTo. In each instance, Gary's other reporting relationships will be indicated.
AltReportsTo is subtly different than AuxReportsTo. See AuxReportsTo for more information on that data field.
If the IsAssistant field is included in an import file, OrgPlus can automatically format assistants in your chart. Setting IsAssistant to 1 for a record makes the corresponding box an assistant.
For example, if the IsAssistant field for Corinne Speer is set to 1 in the import file, the resulting chart is formatted as follows:
![]()
Note: You can specify an assistant branch style in the IsAssistant column (refer to the table in the BranchStyle topic below).
If the BreakAt field is included in an import file, OrgPlus automatically inserts a sub-chart break for the corresponding record.
· Setting BreakAt to 0 does not insert a sub-chart break.
· Setting BreakAt to 1 inserts a sub-chart break.
· Setting BreakAt to a text string (such as, Marketing) inserts a sub-chart break and names the sub-chart based on the text.
If the CollapseAt field is included in an import file, OrgPlus automatically collapses or expands the branch associated with each box. Setting CollapseAt to 1 collapses a branch.
Using the BranchStyle advanced data field applies the branch style you specify to all subordinates of the selected record. By default, charts created using the Import Wizard select chart styles that minimize the total number of pages and optimize the distribution of boxes on each page. You can change the default branch style by clicking the Home tab and selecting Optimize Branch Style.
The following branch styles are available:
|
Branch Style |
Name |
Branch Style |
Name |
|
|
TreeStyle |
|
ListStyle |
|
|
TreeLeftStyle |
|
LeftListStyle |
|
|
TreeRightStyle |
|
BoxListStyle |
|
|
TreeStaggerStyle |
|
BoxListLeftStyle |
|
|
TreeStaggerLeftStyle |
|
BoxListRightStyle |
|
|
TreeStaggerRightStyle |
|
SuperiorBoxListStyle |
|
|
TwoColumnStyle |
|
Assistant1Style |
|
|
TwoColumnTreeStyle |
|
Assistant2Style |
|
|
FourColumnStyle |
|
Assistant3Style |
|
|
FourColumnTreeStyle |
|
Assistant4Style |
|
|
OneColumnStyle |
|
Assistant5Style |
|
|
OneColumnLeftStyle |
|
Assistant6Style |
|
|
OneColumnCenterStyle |
|
Assistant7Style |
|
|
OneColumnLeftCenterStyle |
|
Assistant8Style |
|
|
OneColumnEdgeLeft |
|
OneColumnEdgeRight |
|
|
MultiColumnLine |
|
CoManagerStyle |
|
|
MultiColumnPair |
|
|
The Sequence field allows you to control the order in which subordinate boxes are arranged under a manager. Boxes are sequenced from left to right and then top to bottom.
For example, importing the following data ...
|
ID |
ReportsTo |
Name |
Title |
Sequence |
|
1 |
|
Lynn Brewer |
CEO |
0 |
|
2 |
1 |
Larry Stevens |
VP Sales |
3 |
|
3 |
1 |
Claire Chancellor |
VP Engineering |
2 |
|
4 |
1 |
Fred Barnes |
VP Marketing |
1 |
… would create the following chart:
Notice that Larry Stevens, assigned sequence number 3, is third from the left.
The Sequence field can also be used to sequence subordinates in multiple rows and columns beneath a manager. To achieve this, enter row number and sequence number separated by a : for each import record.
For example, importing the following data …
|
ID |
ReportsTo |
Name |
Title |
Sequence |
|
1 |
|
Lynn Brewer |
CEO |
0 |
|
2 |
1 |
Larry Stevens |
VP Sales |
1:1 |
|
3 |
1 |
Claire Chancellor |
VP Engineering |
1:2 |
|
4 |
1 |
Fred Barnes |
VP Marketing |
1:3 |
|
5 |
1 |
Gary Truman |
Director Operations |
2:1 |
|
6 |
1 |
Martin Sawyer |
Director Finance |
2:2 |
… would create the following chart:
The Exclude field allows you to determine how each box in your chart is handled with respect to calculations.
Setting Exclude to 0 includes a box in all counts and calculations.
Setting Exclude to 1 excludes a box from all counts and calculations.
Setting Exclude to 2 excludes a box from all counts.
Setting Exclude to 3 excludes a box from all calculations.
The Format field allows you to specify the format for any given box. The example below contains a subset of available options. See the OrgPlus Knowledge Base at www.orgplus.com/support for more information on the Format advanced data field.
|
ID |
ReportsTo |
Name |
Title |
Format |
|
1 |
|
Lynn Brewer |
CEO |
fields_show=”Name, Title”, font=”Verdana,12, blue” |
|
2 |
1 |
Larry Stevens |
VP Sales |
fields_show=”Name,”, font=”Verdana, 9”, box=”round_rect” |
|
3 |
1 |
Claire Chancellor |
VP Engineering |
fields_show=”Name,”, font=”Verdana, 9”, box=”round_rect” |
|
4 |
1 |
Fred Barnes |
VP Marketing |
fields_show=”Name,”, font=”Verdana, 9”, box=”round_rect” |
The Special field allows you to specify chart formatting parameters such as chart title and chart background color. See the OrgPlus Knowledge Base at www.orgplus.com/support for more information on the Special field.
|
ID |
ReportsTo |
Name |
Title |
Special |
Format |
|
|
|
|
|
title=”My Corp” |
font= “Verdana, 24” |
|
|
|
|
|
chart="My Corp" |
chart_fill=”solidfill, green” |
|
1 |
|
Lynn Brewer |
CEO |
|
|
|
2 |
1 |
Larry Stevens |
VP Sales |
|
|
|
3 |
1 |
Claire Chancellor |
VP Engineering |
|
|
In the above example, the resulting chart will have:
The title "My Corp" in 24-point Verdana font (see orange boxes for formatting style).
A solid green background (see green boxes for formatting style).
The Special field can also be used to ignore any row from the import data source. For example, as shown below, an Excel file containing a summary row.
|
ID |
ReportsTo |
Name |
Title |
Salary |
Special |
|
1 |
|
Lynn Brewer |
CEO |
125,000 |
|
|
2 |
1 |
Larry Stevens |
VP Sales |
75,000 |
|
|
3 |
1 |
Claire Chancellor |
VP Engineering |
100,000 |
|
|
|
|
|
Total |
300,000 |
Ignore |
The AuxReportsTo field allows you to specify one or more auxiliary reporting relationship within your chart.
Importing the following data:
|
ID |
ReportsTo |
AuxReportsTo |
Name |
Title |
|
1 |
|
|
Lynn Brewer |
CEO |
|
2 |
1 |
|
Larry Stevens |
VP Sales |
|
3 |
1 |
|
Claire Chancellor |
VP Engineering |
|
4 |
1 |
|
Fred Barnes |
VP Marketing |
|
5 |
2 |
4 |
Gary Truman |
Director Sales/Marketing |
|
6 |
3 |
|
Martin Sawyer |
Director Engineering |
Would result in the following chart:
Note: Multiple auxiliary reporting relationships for a single record must be separated by semi-colons.
You can define the appearance of auxiliary lines prior to import by adding formatting rules to the AuxReportsTo field.
You can define the following line attributes:
Label: Label content is enclosed in quotes ("10%").
Line style: Define the style of auxiliary lines by including the word solid, dashed or dotted.
Line weight: Define the thickness of the line by including a numeric value representing the point weight (.5, for example).
Color: Define the color of a line by including a six-digit hexadecimal value (#FFFFFF).
Properties: Define the line property by including the one of the following words:
around creates a line that travels around the other boxes in the chart.
under creates a line that travels under the other boxes in the chart.
Style: Define the style of the line (whether it is an arrow, and if so, how the arrow appears) by including the one of the following words:
none creates a plain line.
begin places an arrow pointer at the beginning of the line.
end places an arrow pointer at the end of the line.
both places an arrow pointer at each end of the line.
Strings of formatting rules are placed in parentheses following the numeral representing the AuxReportTo relationship. In this example, Gary Truman's auxiliary reporting relationship will represented by a .25 point white dotted line, that wraps around the chart, and bears the label "40%".
Each defined formatting rule is carried over to unformatted rules in subsequent AuxReportsTo relationships. For instance, in this example, all of the formatting rules applied to Gary Truman's auxiliary reporting line are applied to Martin Sawyers, except for the label - Martin Sawyer's line bears the label "30%" instead.
Note: If auxiliary lines overlap, the connecting line appears dashed:
The ReportsToFormat field allows you to define the attributes of the ReportsTo lines connecting managers and their reports. In the following sample chart, the line connecting Lynn Brewer to her report, Larry Stevens, is indicated in the ReportsToFormat field.
|
ID |
ReportsTo |
Name |
Title |
ReportsToFormat |
|
1 |
|
Lynn Brewer |
CEO |
|
|
2 |
1 |
Larry Stevens |
VP Sales |
“75%”, solid,.5,#000000 |
|
3 |
1 |
Claire Chancellor |
VP Engineering |
|
|
4 |
1 |
Fred Barnes |
VP Marketing |
|
Formatted attributes and rules are similar to those described in Formatting Auxiliary Lines above, with a few differences.
For reporting relationships, you can define the following connecting line attributes:
Label: Label content is enclosed in quotes ("10%").
Line style: Define the style of auxiliary lines by including the word solid, dashed or dotted.
Line weight: Define the thickness of the line by including a numeric value representing the point weight (.5, for example).
Color: Define the color of a line by including a six-digit hexadecimal value (#FFFFFF, for example).
Strings of formatting rules are separated by commas. In the example above, the line connecting Larry Stevens to his manager, Lynn Brewer, will be represented by a .5 point solid black line, that wraps around the chart, and bears the label "75%".
In the example above, because Lynn Brewer's subsequent reports in the table (Claire Chancellor and Fred Barnes) have no formatting specified, formatting for Larry Stevens is applied to their connecting lines. You can format one or more line attributes for those subsequent reports by adding the new attribute(s) to the ReportsToFormat field. For instance, in this example table, Lynn Brewer's other reports have different labels applied to them, but all other line attributes are as defined in Larry Stevens' ReportsToFormat field.