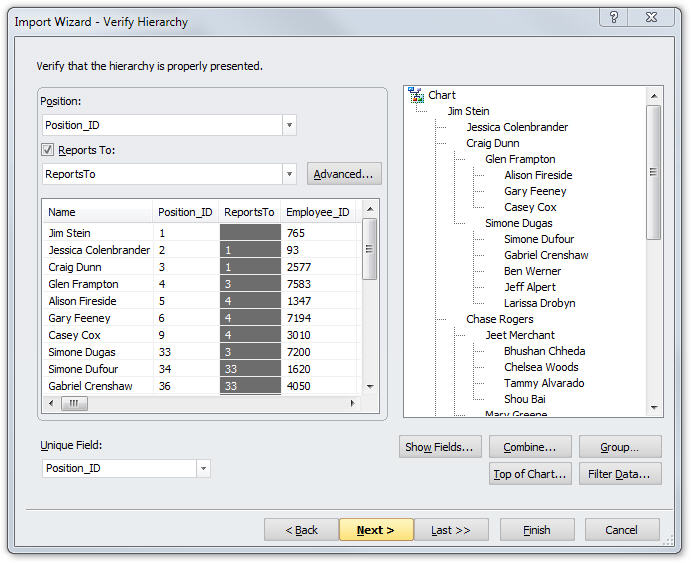
Click the Next button in the Data Settings dialog box to display the Verify Hierarchy dialog box, You can verify that OrgPlus is building the chart hierarchy correctly. You can set a filter to define a subset of source data to import into a chart, such as a division within an organization.
In the following example, the source fields ID and ReportsTo are the default choices for the Position and Reports To fields. The chart hierarchy built (based on the selected Position and Reports To fields) appears on the right side of the dialog box.
To define the chart hierarchy:
1 Identify the Position field. You can specify the field used as the Position (unique identifier) using the Position drop-down list.
2 Identify the Reports To field. You can specify the field used as the Reports To identifier or deselect the option if the data source does not contain hierarchy information, or if you want to exclude the Reports To information contained in the data source.
Notes:
Optionally, you can change the fields that are displayed in the Import
Wizard by clicking the Show Fields button. This is helpful if the
Name field does not provide enough information to verify that the
hierarchy is correct.
Use the Advanced button if your data contains a hierarchy that cannot
be processed using only the Reports To and Position fields.
See Advanced Import.
3 Identify the Unique Field. Use this dropdown list to specify the field that will uniquely identify each record during the data refresh process.
Note: Click Filter Data to select a subset of information from the data source. See Filtering Data for more details.
4 After you finish defining the hierarchy and data filtering options, click Next.
If there are unassigned positions (orphans) in your source, the Unassigned Positions dialog appears:
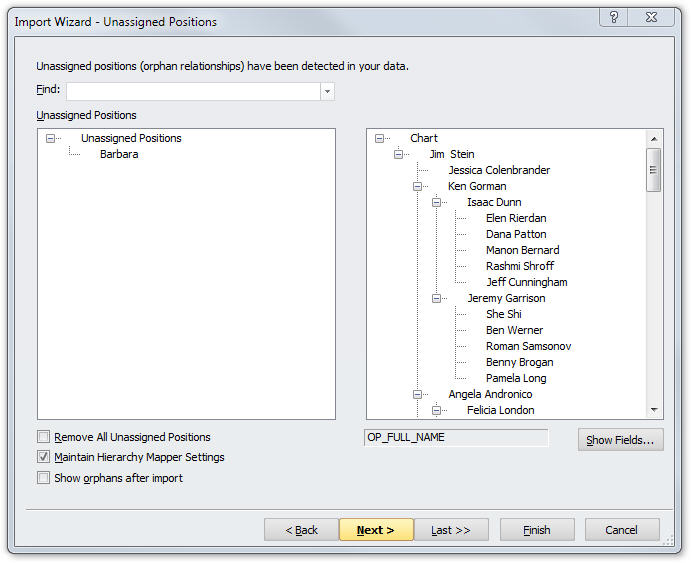
See Unassigned Positions for details on handling orphans during the import process.
5 If your chart has at least four levels, the Create Sub-charts dialog appears:
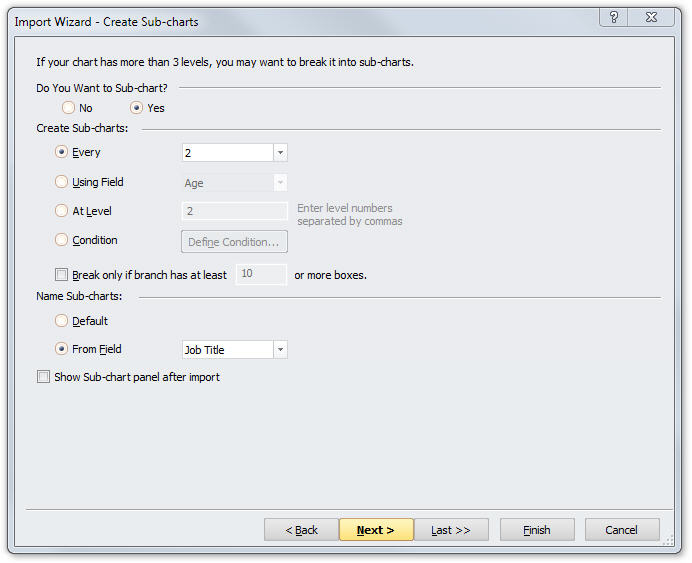
See Creating Sub-Charts for more details on creating sub-charts during the import process.